
May 2, 1994
. . . And he gets the bunt down. Jones charges. No chance on the lead runner. Jones fires it to first. 1-3 on the putout. 2 down.
Top of the 3rd. Giants nothing. Mets nothing. Second baseman John Patterson will dig in for his second crack at Bobby Jones. He grounded out in the Giants’ half of the first.
2-2 pitch on the way. Patterson hits a groundball to short . . . but it’s bobbled by José Vizcaíno! Portugal rounds third, he will score. It’s 1-0 Giants after the E6 from Vizcaíno. Runner at first, still 2 down. Jones should be able to limit the Giants to just the 1 run.
But how does that saying go? “You can’t give a Major League team an extra out.”
Next up is Matt Williams, who grounded out to short in the first. The Giants’ third baseman has become a strong power threat. So far this season, he’s Slugging .699 on the back of 11 Homers. He’s on an incredible pace!
Williams hits a high flyball down the leftfield line. If it’s fair . . . It’s gone! A 2-Run Home Run for Matt Williams! It’s 3-0 Giants. That’s why you can’t give a Major League team an extra out.
Now batting . . . the leftfielder . . . number 25 . . . Barry Bonds.
The 3-time NL MVP popped out to short left field in the 2nd. By his standards, he’s been cold, slashing .237/.376/.500 coming into this contest. Jones goes down 2-0 to Bonds. He may not be at peak form, but you’re always flirting with fire when pitching to Bonds.
2-0 on the way. Bonds hits a line drive to right. That’ll fall in for a base hit. Consider it a victory to hold Bonds to a single.
RF Willie McGee, whose 1-1 with a single, is next. He’s in the twilight of his career, but McGee has still been around League average, slashing .288/.319/.409 so far this season.
2-2 pitch to McGee . . . There goes Bonds! Pitch is outside . . . throw to second . . . not in time! Bonds swipes second base! That’s his 5th on the year.
With a base open for McGee on 3-2, Jones walks him to put runners at first and second. Still, there’s 2 outs, so Jones should be able to get out of this inning and limit any further damage.
SS Royce Clayton will look to keep this 2 out rally going. He flied out in the second inning. This time he hits a groundball to the right side . . . and Jeff Kent bobbles it! E4 and the bases will be loaded for first baseman Todd Benzinger. But, with a forceout at every base, Jones should be able to leave ‘em loaded and keep the Giants’ Big Inning to 3 runs.
Benzinger hits a line drive! Base hit! Bonds scores! McGee scores! Clayton advances to third on the 2-run single by Todd Benzinger. It’s now 5-0 Giants.
Runners at the corners, still 2 away for the catcher Jeff Reed, who bounced out to begin the inning. And with that we can officially say that the Giants have Batted Around!
Jones uncorks the 1-1 pitch . . . it’s in the dirt! Clayton advances 90 feet to score the 6th run of the inning! Benzinger takes second, and it’s now 6-0 Giants.
With the count now at 2-1, they Intentionally Walk Reed. That’ll make it runners at 1st and 2nd for the starting pitcher Mark Portugal who singled and scored the first run of the game earlier in the inning. Coming into this season, Portugal has rocked a 22 OPS+, indicating he’s 78% worse than the League average. You’d think that this would be the end of the Giants rally as Bobby Jones issues Ball 1.
1-0 on the way. Ball 2! That’s 5 consecutive balls for Bobby Jones. They have Frank Seminara warming in the pen. He’d better get ready in a hurry!
The 2-0 pitch on the way . . . Portugal hits a high flyball. Racing back is the centerfielder Thompson! It’s over his glove! Benzinger scores! Reed’s right behind him! Portugal to third base on the 2-Run triple! That’s now 8 runs in the inning, all with 2 outs!
Bobby Jones must be thinking, “What if we had just gotten that third out?!”
Earn Your Runs
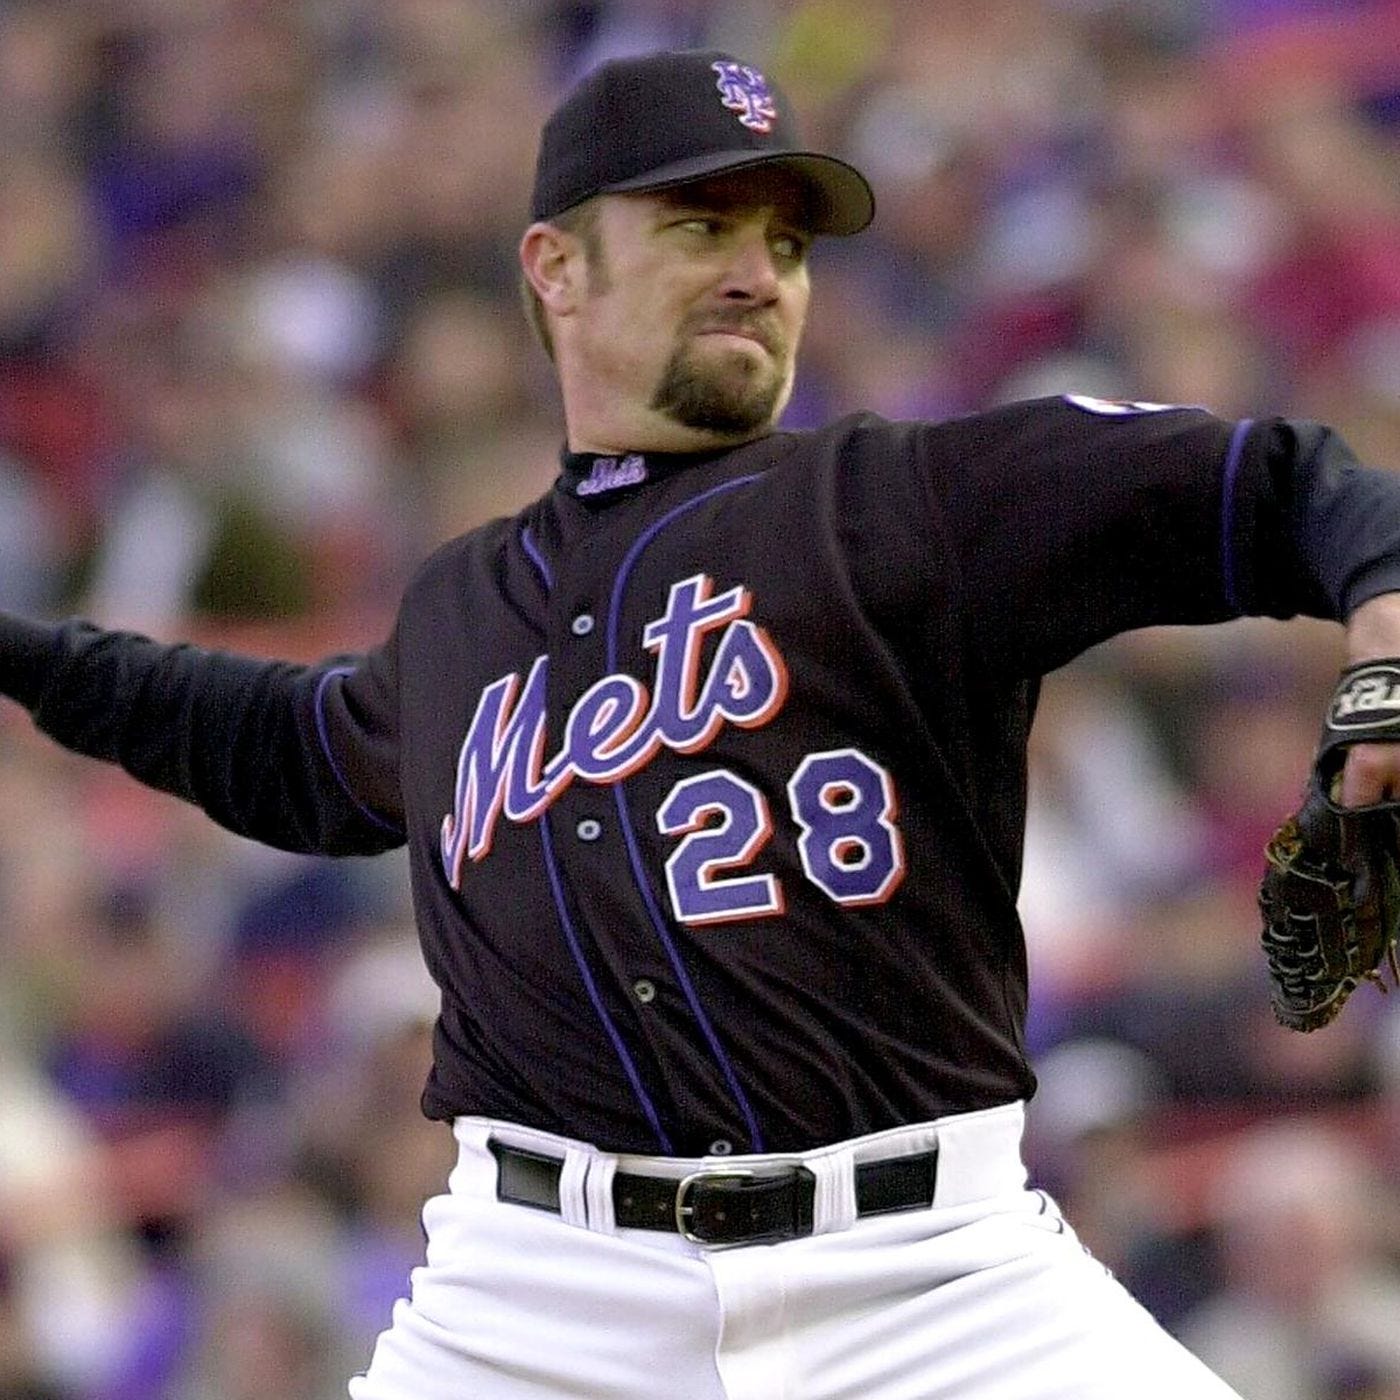
Bobby Jones gave up a 1-run single after Portugal’s Triple, making the Giants’ lead 9-0. He would be pulled from the game, with Frank Seminara taking over. Seminara immediately got the final out of the inning on a flyball. Bobby Jones’ line for this game looked like this . . .
In Part 1 of this Fuzzy Numbers series, we learned how the Pitcher Win is a problematic stat for evaluating pitchers because it is confounded with many factors outside of the pitcher’s direct control, like Run Support. We settled on the idea that a pitcher’s primary objective is to get outs and prevent runs. We used ERA as the best metric for evaluating whether a pitcher accomplished those objectives. In the case of this Bobby Jones outing, did he do his job? Using the Earned Run and ERA, it looks like he did. Entering that game, Bobby Jones’ season ERA sat at 3.16. After he exited that game, it went down to 2.91, 25 points of ERA lower.
Per the definition, “An unearned run is any run that scored because of an error or passed ball.” John Patterson Reached on Error (hey, the name of the name of the blog). That error resulted in the first run of the inning being unearned. This run is not used in calculating Bobby Jones’ ERA. Okay, so that’s one of the 9 runs allowed that is deemed unearned. What about the other 8?
If what would have been the third out of the inning is prevented due to an error, then every run thereafter is considered Unearned. Patterson would have been the 3rd out had that play been made. Therefore, the remaining 8 runs are considered Unearned.
Since 1947 (considered the Integration Era), Bobby Jones’ 9 Unearned Runs Allowed is the second most where a pitcher was also credited with 0 Earned Runs Allowed. For the morbidly curious, the most Unearned Runs allowed since 1947 is 10 by Yankee pitcher Andy Hawkins on June 5, 1989. Parental supervision is strongly advised for the play-by-play data of this game!
This distinction, that some runs are earned and others aren’t, in some ways makes sense. The general intention is understandable. The pitcher did his job, inducing an easy grounder or lazy flyball, but the fielders behind him did not do their jobs. Mets SS Jose Vizcaino and 2B Jeff Kent both had chances to record the third and final out of the inning. Their misplays prevented the inning from ending. Vizcaino’s E6 actually directly led to a run scored. Docking Bobby Jones for that run does seem misleading.
However, equally misleading is how we handle the remaining runs. Yes, if Vizcaino had made that play, the inning would have been over, and none of the runs would have scored. However, one of the primary jobs of the pitcher is to generate outs. After that error, Jones failed to get even 1 out. He allowed 5 clean hits, 2 of which were for extra bases, 2 walks, and a Wild Pitch. Even if you perfectly sequence the remaining hits and walks to minimize the damage, you cannot walk away with less than 5 runs scored as a result. While the defense behind him messed up, shouldn’t Jones have been able to work out of the situation with limited damage? We can start to see how situations like this can begin to cloud the picture that ERA paints. Using Jones’ ERA to judge that outing–and his season as a whole–misses valuable information. We could instead consider the Runs Allowed per 9 innings. We can simply calculate that in the same way we do ERA, but include Unearned Runs in the formula. We call that RA9.
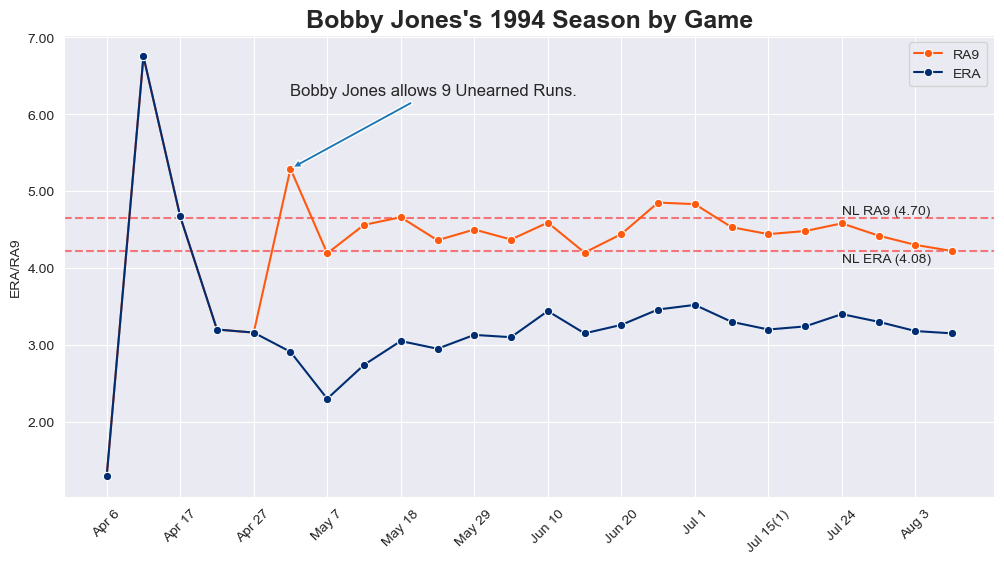
RA9 uses the same scale as ERA, so if you’re comfortable with ERA then you’ll be able to understand RA9. We can see in Figure 1B that RA9 and ERA typically move lock-step with each other, and in many cases are the exact same. By the end of the 1994 season (which ended prematurely on August 11 due the strike), Jones’ ERA was 3.15, meaning he allowed about 3 earned runs per 9 innings pitched. His RA9 was 4.22, meaning he allowed about 4 runs per 9 innings overall. His season ERA was a full 1.07 less than the National League average. In terms of his RA9, he was 0.43 less than the NL average. One metric makes him look better than the League average, while the other paints him as right about average.
Making this distinction between earned runs–the pitcher’s fault–and unearned runs–the defense’s fault–is well-intentioned, but I am afraid it misses the mark because of its blanket approach to accounting for those runs that the pitcher was “responsible for allowing to score.” In terms of Bobby Jones’ outing and season, the Unearned Run is misleading and ultimately absolves him of blame. It’s like saying, “Well, he really should have been out of that inning, so let’s just forgive him for allowing all 9 of those runs.” As the “quarterback” of the defense, we might be better off using RA9, as it accounts for all runs allowed while the pitcher toed the slab.
This got me curious about the differences between ERA and RA9 for established pitchers over the course of AL/NL history. Using Stathead, I found all pitchers in the AL/NL who have tossed at least 1500.0 innings from the Divisional Era (starting in 1969 and running to the present).
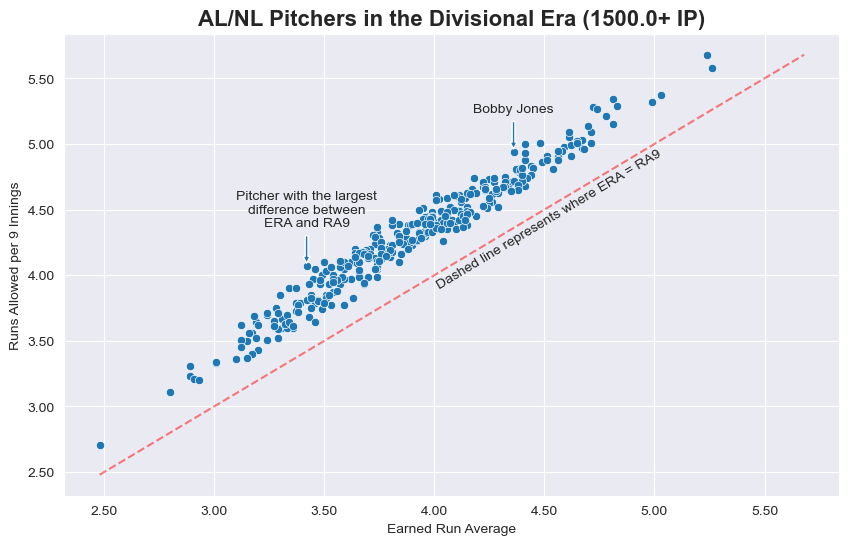
In Figure 1C we see all of the 343 pitchers in the sample. Every pitcher in the sample had an RA9 higher than their ERA. This makes sense because Earned Runs represent a subset of all Runs Allowed. For each pitcher, the higher their data point is above that line, the larger the delta between their ERA and RA9. We see Bobby Jones whose career 4.94 RA9 was 58 points higher than his 4.36 ERA, the 10th largest gap in the sample.
I figured it might be a good idea to study the pitcher in the sample with the largest gap between ERA and RA9. Studying him might reveal why RA9 may be a better metric than ERA. I was not familiar with this pitcher’s career, but I am so happy that this project allowed me the ability to discover him.
Enter Randy Jones (no relation to Bobby).
Junkyard Jones
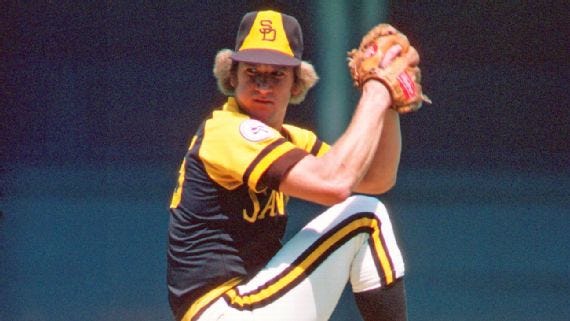
In the infancy of his career, Randy Jones appeared to be quite the talent. His repertoire featured an impressive fastball, with velocity that was apparently hard to catch up to. In his senior year of high school he twirled 0.91 ERA ball with 110 punch outs. During his freshman year at Chapman University, Jones stumbled off the mound and sustained an injury. It apparently affected his stuff quite significantly, as for the remainder of his career he got by without tantalizing velocity. Instead, he relied on a subdued arsenal, with his primary pitch being the sinker. To put it kindly, Randy Jones became a finesse pitcher. To put it less kindly, I’ll let Phillies First Ballot Hall of Fame Third Baseman Mike Schmidt sum it up:
“If I was a pitcher, I’d be embarrassed to go out to the mound with that kind of stuff.”
The San Diego Padres selected Randy in the 5th round of the 1972 MLB Amateur Draft. The Padres must have been impressed with what the young lefty had to offer, because he made his Major League debut in 1973. Although, if we’re being honest, the Padres would gladly let anyone with a pulse pitch for them early in their history. From ‘69 to ‘72, Fathers’ pitchers rocked the 4th worst ERA in the National League.
In Jones’ first two seasons with the Friars, he posted a 3.93 ERA and 4.55 RA9 over 348.0 IP. In 1974, he actually led the entire League in Losses with 22. However, Randy Jones believed he would see a breakthrough in 1975. Why? Let’s go back to what I mentioned earlier about his most used pitch: his sinkerball.
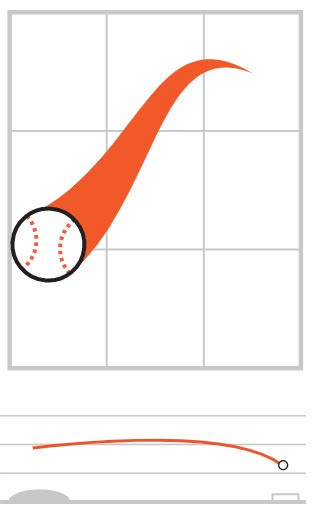
Batted Ball Type refers to, well, just as it says, the type of batted ball allowed: Ground ball, fly ball, line drive, or pop up. Batted ball types were not officially tracked in MLB until 1988, so the data we have for Randy Jones is incomplete. However, what we do have tells us enough. For those unaware of the pitch known as the sinker, take a look at Figure 2A and you get an idea of why this fastball variant gets its name: it sinks!
The pitch’s horizontal movement makes it tough for a batter to square it up. The pitch’s vertical movement makes it a tough pitch for a batter to do anything other than hit on the ground. I think it should be obvious as to why the former is important to a pitcher. What about the latter?
The fly ball is the batted ball type with the lowest Batting Average. AVG on ground balls is 40 points higher, however, note the difference in Slugging Percentage. Fly balls may not fall in for hits often, but when they do fall in for hits, they do damage, leading to extra bases. Ground balls may go for hits on a more frequent basis, but basically always end up as singles, which limit the damage. The ground ball also has the added benefit of potentially being turned into a Double Play. Fly balls can lead to Double Plays, but it’s far less common. Regardless, Jones felt that a lot of the grounders that he induced had found outfield grass. He felt that some of those would start turning into outs. He was right.
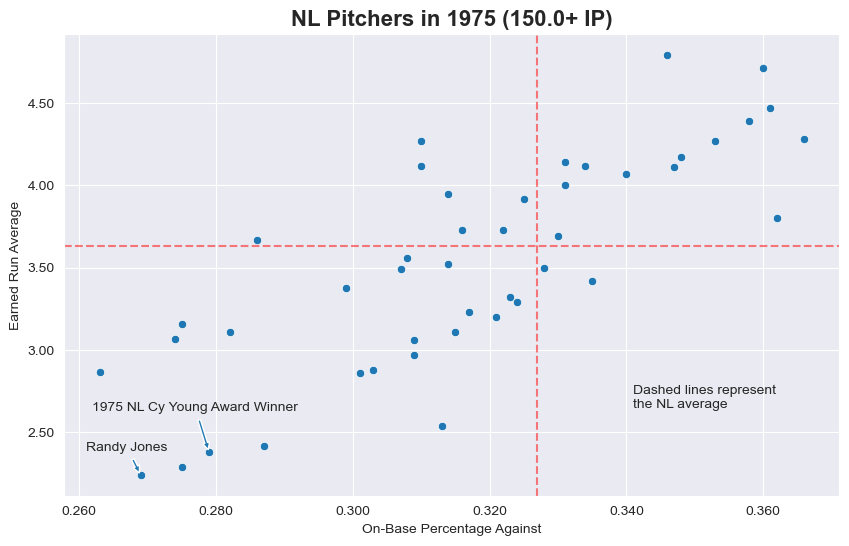
In Figure 2C we see all of the pitchers in the National League with at least 150.0 IP. On the x-axis is On-Base Percentage Against, which communicates the frequency at which batters reached first base safely against a given pitcher. If a batter cannot reach first base safely, then they cannot score. (That’s the level of analysis you can expect from a free blog.) Therefore, a lower OBP should, in theory, produce a low ERA. For the most part, that holds true. Note Randy Jones’ position on this scatterplot.
In 1975, Randy Jones tossed 285.0 innings–which also implies he generated 855 outs–the second most in the NL. Over those innings he allowed 71 Earned Runs to cross the plate. Quick ERA math gives us 2.24. If that sounds impressive, then you’re right! Allowing less than 2.5 Earned Runs per 9 innings means you’re putting your team in a great position to win. In fact, his 2.24 ERA was the lowest mark in the Senior Circuit, within the given sample.
However, Randy Jones also allowed 23 Unearned Runs to cross the plate. For those keeping score at home, that’s 94 Runs Allowed. RA9 math reveals a 2.97 mark. Is that good or bad? Well, it was the 5th best RA9 in that sample of pitchers, so it’s still quite good. However, what’s most interesting about his ERA and RA9 is the difference between the two, and how he stands out among his peers. Check Figure 2D below.
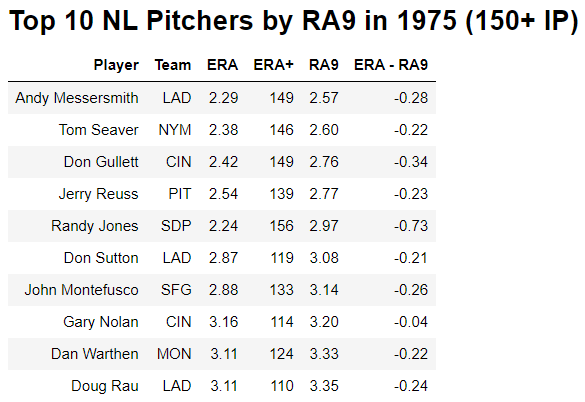
Included are each pitcher’s ERA, ERA+, RA9, and the difference between ERA and RA9. Most of the pitchers on this Top 10 list are within or right around one standard deviation of the mean differential. Certainly, the majority of these pitchers are below that average differential, communicating that their ERA and RA9 were pretty much in lock-step with each other. However, just like that Sesame Street song, one of these pitchers is not like the others. It’s Randy Jones!
Randy Jones’ 73 point differential in ERA and RA9 was tied for the 7th largest. In Figure 2E we see the 10 pitchers with the largest differential in the sample. Yet again, one of these pitchers is not like the others. The majority of these pitchers are around average to well below average in terms of run prevention. Except for Randy Jones. What might account for this discrepancy between his ERA and RA9?
Note that Randy Jones is joined by two of his rotation mates, Dave Freisleben and Dan Spillner, who saw 16 and 14 UER Allowed respectively. On the surface, this appears to communicate that the Padres’ defense was subpar. By the traditional defensive metrics, it sure would seem that way, as San Diego led the National League in Errors that season (188). Another traditional defensive metric is Fielding Percentage.
Essentially, Fielding Percentage attempts to communicate the frequency of successful defensive plays made per fielding chance. As you might expect, the Dads were also the worst in the NL that season by that particular metric. Their .971 Fld% means that the San Diego defense made a putout or assist on 97.1% of their “defensive chances.” Sure seems like they gave their opponents a lot of extra outs to work with, so that probably explains the discrepancy in Randy’s ERA and RA9, right?
Not one for just accepting the common-sense, surface-level answer, I wanted to look deeper. Padres fielders may have been bad, but were all of Randy Jones’ NL leading 23 UER the fault of the defense? Were any of them similar to Bobby Jones’ Unearned Runs in that 1994 game against the Giants? I searched Randy’s game log for the 1975 season and found 16 games where an Unearned Run was scored. I checked the play-by-play data and used my best judgment to sort the UER into three groups: Randy’s Fault, the Defense’s Fault, and I Don’t Know (IDK). This is what I found.
6 of the 23 Unearned Runs were ambiguous to me. Were they the defense's fault? Randy’s fault? I honestly couldn’t tell. It seemed like it belonged somewhere in the middle. As an example, let’s look at Randy’s June 14 outing at home against the Mets. In the 2nd inning, Randy allowed a leadoff double to Joe Torre. Cleon Jones lined out to center, apparently deep enough so that Torre could tag up from second and scoot over to third. Dave Kingman grounded it to third baseman Mike Ivie. Torre broke for home and Ivie apparently believed he could cut down Torre at the plate. The throw was apparently botched. There was an Error assigned to Ivie on the throw. Torre scored, but it was considered Unearned because of that error. Now, I wasn’t at this game. If footage exists, it’s not readily available for me to view. The Official Scorer apparently believed that had the throw home been made cleanly, Torre would have been put out. Maybe he was right, or maybe he was wrong. Ivie could have just conceded the run and gotten the out at first–which would have been an Earned Run in that instance. I was not sure how to properly assign blame on this particular play, so I filed it in the IDK bucket. I could see blame being assigned either way, but it’s probably shared in some way between Randy and Ivie.
I believe that 7 of the Unearned Runs were definitely the fault of poor defensive play. For example, let’s look at August 20 when the Friars crossed the border to play the Expos. Bottom of the 4th, 1 down with runners at second and third, San Diego catcher Fred Kendall (yes, the father of Jason) tried to pickoff Bob Bailey at third. Apparently, this play was so botched that not only did Bailey score from third, but also Larry Parrish from second. Those two runs were as a direct result of a poor defensive decision by Kendall. Seems disingenuous to hang those runs onto Randy.
I believe the remaining 10 runs were indeed Randy’s fault. To illustrate what that looks like, we’ll look at his August 11 outing at the Mets. In the 1st with 1 out and a runner at second, Jesús Alou reached on an error by third baseman Ted Kubiak. Okay, no big deal, runners at 1st and 2nd. With 1 down, a Double Play ends the inning. Jones proceeded to allow a 1-Run Single to Rusty Staub that scored the runner at 2nd, Félix Millán. Runners at 1st and 2nd still, he allowed a Double to Joe Torre, scoring Alou and sending Staub to 3rd. Alou “should have been” retired on that E5, so his run was considered unearned. Ed Kranepool then grounded into a 4-3 putout that scored Staub. That run was considered unearned because, had Alou been put out “as he should,” then that 4-3 would have ended the inning and Staub’s run wouldn’t have counted. I don’t see why that simple mistake suddenly absolves Randy Jones of blame. He had the opportunity to close out that inning with a zero in the run column.
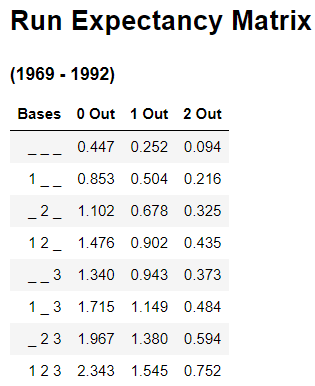
Let’s try to quantify just how much the defense messed up in this instance. To help with this, I’ll be using a Run Expectancy Matrix1, which we discussed in my article on the Stolen Base. As a refresher, the Run Expectancy Matrix tells you the average number of runs scored until the end of the half-inning for a given base-out state. The particular matrix I am using spans the 1969-1992 seasons and was generated by the new wizard of Sabermetrics Tom Tango.
Before that error, there was a runner at 2nd with 1 out. The expected number of runs scored was 0.678, a little more than two-thirds of a run. After that error, it was runners at 1st and 2nd with 1 out, with a run expectancy of 0.902. That’s a swing of 0.224 expected runs, less than a quarter of a run added to the expected total. 3 runs scored in the inning. If we say that the defense is responsible for 0.224 of those runs, then Randy is still responsible for the remaining 2.776 runs, representing about 93%. The defense messed up, but it’s still Randy’s job to generate outs and prevent runs from scoring.
Let’s say we split those 6 IDK runs in half, giving 3 to Randy. Those plus the 10 that I deemed to be Randy’s fault would increase his ERA by 41 points, from 2.24 to 2.65, which would have been the 5th best mark in the NL.
I want to be clear in my intentions with this exercise. I am looking at play-by-play data only. I have no visual account of these games. Is my judgment incredibly subjective? Yes. What authority do I have in assigning credit or blame? None. That’s the entire point.
Many baseball traditionalists will go on about how the traditional stats are the best because they directly count or measure objective events on the field. Strangely enough, the Error–which births the Unearned Run–is one of those traditional stats that breaks from that mold, representing a sort of hypothetical reality where a play should have been made, but wasn’t. The decision of Error–and thus Earned vs. Unearned Run–is the judgment of the Official Scorer–with the keyword being judgment. Who is the Official Scorer?
Since 1980, the Official Scorer has been an independent entity hired by MLB itself. Prior to that time, the Official Scorer was typically a member of the press–like a beat writer– in the home team’s city. If that causes a red flag to go off in your mind because of a potential conflict of interest, then I think that’s a healthy response. By introducing this concept of earned versus unearned runs, we introduce human bias and subjectivity into our methodology of judging a pitcher by his ERA. It is this subjectively that ultimately clouds the signal of ERA. Instead of deciding what runs scored as a direct result of Randy’s pitching versus the result of poor defensive play, I claim we’re better off not making the differentiation at all, instead focusing on all Runs Allowed and use RA9 as a metric to evaluate a pitcher’s rate of allowing runs. In terms of answering the question “what happened while that pitcher was on the mound,” RA9 answers it better than ERA.
In terms of why Randy’s ERA was so much lower than his RA9, it could be because of favorable scoring decisions by the Official Scorer. Or, maybe, it’s because of Randy’s pitching style, which as mentioned earlier produced a lot of balls in play on the ground. To quantify this, let’s consider the number of Balls in Play (BiP) Randy Jones allowed.
For those wondering why BiP factors out the Home Run, let me explain. Home Runs, for the most part, are out of the field of play and cannot be defended. Is that entirely true? No. Think about the wall-scraper where a fielder reaches over the yellow line and potentially robs the 4-Base Hit. Or, the Inside-the-Park Home Run, which is obviously in the field of play and can be defended. Those are quite rare in today’s game and are not tracked separately from Over-the-Fence Home Runs, so hopefully you understand the intent in factoring out the Homer when considering balls in play. Hopefully, the exclusion of Strikeouts, Walks in both of their forms, and Hits By Pitch makes sense to you as well.
When doing that math for Randy Jones, he allowed 939 Balls in Play, the second most in the NL that year. This meant that of the 1124 Batters Faced, approximately 84% of them put the ball in play against Randy Jones. For comparison, Houston’s ineffectively wild J.R. Richard2 saw 64% of the 905 batters he faced put the ball in play, the lowest ratio in the sample.
Of the batted balls that were tracked during Randy’s 1975 season, 585 of his Balls in Play were on the ground. That’s about 62%. Again, for comparison, among pitchers with at least 150.0 IP from 1988 to 2023, Derek Lowe posted the highest ground ball rate in a single season, when he allowed 67% of balls in play on the ground as a Dodger in 2006. So, why is all of this important?
Using Stathead, I found that from 1988 to 2023 that there have been 67847 Reached on Errors (Hey, the name of the . . . oh, I made that joke already). 61478 of those were on grounders of some form. That’s about 91% of Errors on batted balls as a result of ground balls.
Those grounders do tend to be easy outs, as backed up by the low AVG on grounders we discussed earlier. However, grounders are more likely to be errors than other batted ball types. This could be due to factors like limited reaction time on hard ground balls. A bad hop on a less-well-maintained infield dirt could result in a ball that looks playable, but is hard to field cleanly. When coupled with the subjectivity of official scoring decisions, that could increase the rate of Errors for ground ball pitchers. That does appear to be somewhat true. To return to the 2006 example, Derek Lowe and NL Cy Young Award winner Brandon Webb–a noted ground ball specialist himself–saw the fielders behind them commit 16 and 15 Errors respectively, the 1st and 2nd most in the Bigs that year. Were the fielders just bad? We’ll save analysis of fielding for a later installment of Fuzzy Numbers, but it seems as though Lowe’s Dodgers were probably slightly below average3 and Webb’s D-Backs were slightly above.
Suffice to say, the knack for inducing a lot of grounders gives infielders a lot of chances. As mentioned earlier, San Diego did commit a lot of Errors, which deducted their Fielding Percentage. However, in comparison to the rest of the League, the Padres finished 4th in putouts (4390) and 2nd in assists (1930), indicating that they were at least doing something right.
I think this illustrates how two things can be true at the same time. Number 1, the 1975 San Diego Padres–specifically their infield–were probably not the greatest defensive team and, Number 2, Randy Jones had a difficult time limiting damage after their mistakes. Do I think that he was a bad pitcher who was falsely heralded as one of the best in the Senior Circuit? No, absolutely not. While Randy Jones toed the rubber for San Diego, opponents had a difficult time scoring against him, whether you consider his ERA or RA9. He also gave the Padres incredible length in his starts. His pitching style generated a lot of weak contact and ground balls. It helped suppress run scoring, but it also presented more opportunities for fielders to make mistakes. Randy Jones finished second in the National League Cy Young Award voting, 8 first place votes shy of the actual winner that season, Tom Seaver of the Mets, who might have won the award because he finished with an NL-best 22 Wins.
Maybe the more impressive feat is that Randy Jones managed to replicate his 1975 season in 1976. He went the absolute distance for San Diego, pitching in 315.1 innings, the most in all of MLB that year. His ERA of 2.74 was tied for 5th, and his RA9 of 3.11 was 6th in the NL among pitchers with at least 150.0 IP. This time 15 voters put Randy first on their ballots–maybe because he also led all of MLB in Wins with 22–and he took home the prize in 1976.
1978 was Randy’s last good season, which actually was the most egregious in terms of differences in ERA and RA9. His ERA of 2.88 was the 12th best among NL pitchers with at least 150.0 IP. His RA9 was nearly a full run higher, 3.70, and was only the 20th best mark. This came on the back of 23 UER again. Were all of them the fault of the defense? The true answer is that it’s shared in some way, but how much blame goes to each of the parties involved is ultimately subjective–at least, with the tools available to analysts at that time.
Regardless of where you fall on this, I think Randy Jones exemplified how, to be a great pitcher, you don’t need nasty stuff. You can have success by having an arsenal that caters to weak contact. But, maybe more so for me, he exemplifies why I enjoy writing about baseball the way I do. I was not familiar with Randy and his career before embarking on this endeavor. His story is one with a short peak, but a lot of richness. I am happy to include him in this project, where I am trying to tell the story of the game while teaching my readers about Sabermetric analysis.
But this story is not quite over. We can see how the Earned vs. Unearned Run can cloud the signal of ERA. However, this assignment of blame on a pitcher in terms of run prevention can occur even when they’re not on the mound. To help illustrate this, I’ll introduce another pitcher who I had never heard of, and he serves as another example of why this blog is so rewarding.
Enter Willard Nixon.
I Am Not a Crook
Willard Milhouse . . . I mean, Lee . . . Nixon pitched in the Big Leagues for 9 seasons, from 1950 to 1958, all with the Boston Red Sox. His career was not illustrious. In fact, he was pretty much the definition of an average pitcher. He posted a career 4.39 ERA (4.92 RA9) which amounted to a 98 ERA+, meaning he was 2% worse than the League average in terms of preventing Earned Runs. Slightly below average, but basically average.
However, when he ultimately passed in December of 2000, Time noted his passing in a memorial section, typically reserved for people with far higher status than Willard Nixon. Why the feature? Well, Mr. Nixon was well-known in Boston circles for his ability to silence the New York Yankees. Over the course of Nixon’s career, the Yankees won 6 World Series and 8 American League Pennants. They were a juggernaut!
However, among pitchers with at least 200.0 IP against the Yankees in the 1950s, Willard Nixon posted the 3rd lowest ERA against the Bronx Bombers, 3.55, and 5th lowest RA9, 4.07. He held the Yanks to a .236/.320/.355 Slash Line when the club’s Slash Line for the 1950s was .268/.344/.415. Suffice to say, Willard Nixon kept a vaunted lineup in check.
But the reason I am bringing up Willard Nixon is not because of his success against New York. How does Willard Nixon illustrate one of ERA’s flaws? We’ll consider Willard Nixon’s 1956 season. It was hampered by injury, but he did manage to start in 22 of Boston’s games and tossed 145.1 innings. Let’s examine that 1956 season in terms of American League pitchers with at least that many innings!
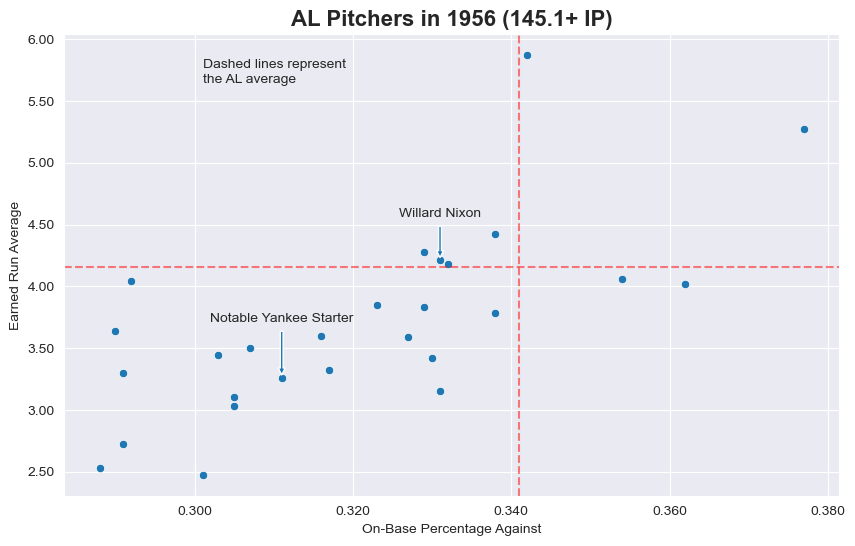
Nixon allowed runners to reach first safely at a rate below the American League average, but he still gave up quite a few runs. His 4.21 ERA was slightly above the AL average of 4.17. From that alone, you’d probably say that Willard was basically average, if not slightly below average, in terms of preventing Earned Runs. However, remember Willard Nixon pitched his home games at Fenway Park. In the words of John Updike, Fenway Park is a “lyric little bandbox of a ballpark.” In layman's terms, that means it was pretty easy to hit homers at Fenway, thus meaning it was pretty easy to score in general. In the 1950s, Fenway Park led all of MLB in AVG and OBP, and the AL in SLG. When you account for those factors in Nixon’s ability to prevent Earned Runs, his 110 ERA+ indicates he was actually 10% better than the League average. That’s why it’s helpful to consider the run scoring environment and the ballparks you pitch in. However, I claim that Willard Nixon was even better than those two metrics indicate. Let’s introduce the idea of a Bequeathed Runner!
Suppose Willard Nixon is pitching. He gets 2 outs, then allows 2 batters to reach first safely. His manager, maybe sensing that Nixon is faltering a bit or that he could get a favorable platoon matchup, decides to make a call to the bullpen and bring in a reliever for the next batter. Nixon has left 2 runners on for the reliever to deal with. Those runners left behind are known as Bequeathed Runners.
We don’t expect pitchers to be perfect. They will inevitably allow batters to reach safely. While in prior eras of the game we might expect the starter to pitch the entire game, we don’t expect it as much anymore. It was certainly still commonplace in the 1950s for starters to “finish what they started,” but even the best starters will eventually need some relief. Detroit’s Frank Lary started an AL-best 38 games. He completed only 20 of them.
Now, let’s say that the reliever who came in for Nixon immediately gives up a 3-Run Home Run. Those Bequeathed Runners that score are added to Nixon’s line, even though he’s not the pitcher that allowed them to cross the plate. This means of accounting has always unsettled me. I understand the logic to an extent. Nixon put those runners there, so he certainly has some responsibility when those runners come around to score. However, he’s not fully responsible. Someone else played a role in them crossing the plate. It’s like saying, “Well, those runners were gonna score anyway.”
You can probably guess where I am going next.
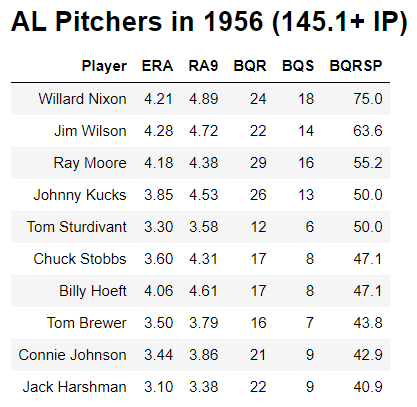
In Figure 3B we see the AL pitchers in the sample with the highest Bequeathed Runners Scored Percentage (BQRSP). Willard Nixon tops the list with 18 of his 24 Bequeathed Runners coming around to score. Three-quarters of the runners he handed off to the Red Sox bullpen came around to score while he was in the dugout, probably pacing back and forth as he calculated what his ERA would look like after the reliever blew it.
Compare this to notable Yankee starter Don Larsen. He left 31 runners on base for his relievers to clean up. Only 8 of them (25.8%) came around to score. Widening the scope, the Red Sox bullpen saw 153 Inherited Runners, the 6th fewest in all of MLB. 82 of those runners (54%) came around to score, the highest mark in MLB. Compare this to the Bronx Bombers leaving relievers with 201 runners, the 3rd most in the League. 69 (34%) of them came around to score, the 6th best mark. The Sox Starters were pretty good at not leaving runners for relievers, but unfortunately they bore the negative impact of them scoring because their bullpen simply couldn’t strand them.
To establish the point I am trying to make here, if those 18 runs scored attributed to Nixon were erased, his ERA would drop 111 points of both ERA and RA9, representing more than 1 runs worth of difference in those two rate metrics. Even if Willard Nixon could see only a quarter of his bequeathed runners come around to score, close to the proportion Larsen saw score, those two metrics would drop by 84 points. If Larsen had seen Nixon’s misfortune, and 23 of his 31 bequeathed runners ended up scoring (approximately 75%), then his metrics would increase by 75 points. We can see that while ERA and RA9 do tell us a lot about how a pitcher prevents runs, it still has some noise left behind due to the effect of relievers–good or bad–which is something outside of the pitcher’s control or influence.
The solution to this could simply be to not count those runs towards the starter’s total and instead attribute them to the reliever, but that would obviously not be the proper solution, as now the same problem occurs but with relievers. There’s clearly some proportion of responsibility when a starter leaves behind runners. Another simple solution could be to just divide the runs in half, but that’s not right either. Suppose Nixon left the game having not gotten an out in the inning and having loaded the bases. (Buddy, you’re leaving your reliever in a pretty tough spot!) If those three runners end up scoring, it seems unfair to simply say Nixon is responsible for 1.5 of those runs, and the reliever takes on the other 1.5 runs.
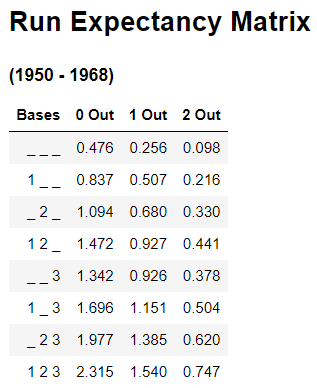
A more elegant solution might involve using a Run Expectancy Matrix, like the one in Figure 3C. The one I am using in this example spans the 1950 to 1968 seasons, which contained the entirety of Nixon’s career. Returning to the example where Nixon loads the bases before getting a single out, historically 2.315 runs have been scored on average. Say the reliever allows those three runners to cross the plate. We could assign 2.315 of those 3 runs (77%) to Nixon, and the remaining 0.685 runs to the reliever. Let’s use this logic and accounting to develop a new ERA-like metric that accounts for these situations and estimates what a pitcher’s ERA would look like without the positive or negative effect of bequeathed runners scored!
In the tradition of many Sabermetric models or stats, I will be using a backronym4. Please allow me to introduce to you Earned Run Average Sans Misattributed Outcomes, or ERASMO, named after current reliever Erasmo Ramirez (not to be confused with the former Erasmo Ramirez). Why did I name this stat after Erasmo Ramirez? Well, because I went to Baseball Reference, typed in “era” into their search bar, and his name was the first on the list. Thank goodness he was a pitcher!
Here’s how ERASMO works. ERASMO takes a snapshot of the base-out state for a pitcher when he exits the game, minus when he exits the game with the bases empty. Using the Run Expectancy Matrix, we find the expected number of runs scored until the end of the half-inning. Sum those values over all games, and use that value in place of the actual number of bequeathed runners scored. Take the pitcher’s actual runs allowed, subtract their bequeathed runners scored, and add back in the expected total. Calculate ERA using that number of runs, and tah-dah! That’s ERASMO! This stat is not live yet for all pitchers, but I can calculate it for 1956 Willard Nixon and Don Larsen.
In 1956, Willard Nixon was debited with allowing 68 Earned Runs. Subtract his 18 runs scored from bequeathed runners, and we’re at 50. Based on the run expectancy matrix and base-out states that Nixon left to his relievers, one would expect 14.256 runs to have been scored. Add those to 50 to make 64.256 Earned Runs Allowed. On the surface, that doesn’t seem like much at all. It's a little less than 4 fewer runs. Willard Nixon’s 1956 ERASMO comes out to . . .
That’s 23 points lower than his actual ERA. It is enough to take him from an ERA slightly above the AL average to an ERA below the average. Again, it may not seem like much, but these small changes have big impacts on how we perceive a pitcher. His ERASMO communicates that he was possibly better than average in terms of run prevention, when factoring out some of the negative impact of the Red Sox bullpen. If his ERA had truly been 3.98, then we’d be able to say he’s a better than average pitcher. Also, whether it’s right or not, a pitcher is perceived differently when their ERA starts with a 3 as opposed to a 4.
Don Larsen’s expected number of bequeathed runners scored came out to 14.354, 6.354 more than reality. That brings his ERASMO to 3.57, 31 points higher than his actual ERA. Among pitchers in the sample, that would be enough to change his 7th best ERA to the 12th best. Again, whether it’s right or not, dropping out of the Top 10 in run prevention changes how we perceive that pitcher.
In terms of how we would perceive these pitchers in comparison, before accounting for bequeathed runners scored, we’d likely say that Larsen was a far better pitcher than Nixon, since his ERA was 95 points lower than Nixon’s. However, when accounting for those runners that scored, we see that their performance was a lot closer than they appeared on the surface, represented by the 41 point gap in their ERASMO.
Now, look, I want to be clear here. Willard Nixon is not some diamond in the rough, underrated by the traditional metrics so much so that he missed out on a chance at Cooperstown. However, it is true that he experienced some particularly bad luck in terms of the relievers behind him, and he bore the negative impact of their inability to strand runners, even though he didn’t pitch with any less quality.
With ERA we claim to capture the pitcher’s ability to prevent runs, and for the most part it’s true. However, we can see in the case of Willard Nixon that the effects of other pitchers can actually mask their contributions. Or, in the case of Don Larsen, can actually bolster their contributions, even though neither pitcher pitched any differently. In the end, aren’t we trying to isolate the role of that specific pitcher?
Results, Results, Results
What we have discussed so far–whether judging a pitcher based on their Wins, Win Percentage, ERA, or RA9–is known as a Results-Based approach to evaluating pitching performance. In Part 1, we discussed how the Pitcher Win really measures the results of the overall team, not specifically the pitcher themself. What have we learned about ERA and RA9 in Part 2?
ERA tells us a lot we need and want to know. However, it too is confounded with other variables like subjectivity in scoring decisions or relief pitchers. RA9 might actually be better at telling us about the pitcher’s contribution to run prevention, but it too is confounded by the effects of relievers and runs that truly were the fault of poor defense. A results-based approach to pitching evaluation is certainly valid. I don’t think we’ll ever get away from looking at ERA. However, it does not fully get to the heart of the overall question about how a pitcher contributed.
Consider two very real, and extremely common examples. Pitcher X is leaving a lot of balls over the heart of the plate. Fortunately for Pitcher X, batters have been mistiming their swings and maybe not producing as high quality contact as they should. Or, when they do make good contact, the ball is fortunately finding a fielder’s glove. Few runs have been scored on these “mistake” pitches, meaning Pitcher X has gotten good results. But should he really keep tossing in pitches middle-middle to Major League batters?
Say that Pitcher Y has been hitting his spots perfectly as of late. He’s been nailing the scouting report and is pitching to the batter’s weaknesses. Unfortunately for Pitcher Y, when batters have made contact they’ve gotten a lot of bloops or “seeing-eye” singles. He’s given up a decent chunk of runs, meaning Pitcher Y has gotten bad results. Should he just scrap his game plan moving forward?
Baseball is a game where you can do everything right and still see poor results. You can do everything wrong and see positive results. On the surface we’d say that Pitcher X is a better pitcher because his results are better than Pitcher Y. However, doesn’t it seem like Pitcher Y’s process is better? And, moving forward, wouldn’t we expect Pitcher Y to start seeing better results than Pitcher X? It’s why having a purely results-based approach to evaluating a pitcher–while useful and informative–can be problematic.
If we’re not going to judge a pitcher based solely on their results, then what else can we do? Maybe we could judge pitcher’s based on the components that they have influence over that contribute to run prevention. Such a method of evaluation is known as a Peripheral-Based approach.
Stay tuned for Part 3 of this Fuzzy Numbers series where we’ll compare and contrast these two approaches by using a First Ballot Hall of Fame starter as a case study. It should be a fun ride!
Thanks!
Thanks for taking the long trot.
Special Thanks go to Alan Cohen for his SABR article on Randy Jones’ life and career, and Wynn Montgomery for his SABR article on Willard Nixon’s. Both provided eloquent details on pitchers I did not have the fortune to see pitch.
Special Thanks to Tom Tango and his Run Expectancy Matrices that provided a lot of context to how defensive mistakes and relievers impact run scoring.
Special Thanks go to Baseball Reference, their Stathead product, and Fangraphs for making baseball data accessible to us all.
And of course, Special Thanks go to Randy Jones and Willard Nixon. Their careers might not have been spectacular, but they most certainly made for a much richer story to tell. I think I would have loved seeing Randy throw “junk” to the National League’s best batters, and Willard stifle a vaunted Yankee lineup.
It could be called a Run Expectancy Table instead, but Matrix is way cooler!
A pitcher is said to be Effectively Wild if they have poor control but still manage to be effective. J.R. Richard’s early career was notably wild, but I use “ineffective” here because Richard did not see good results in terms of ERA. It should be noted that he eventually became one of the National League’s best arms, until a stroke unfortunately ended his potentially Hall of Fame worthy career.
Note that in the audio version of this article, I mistakenly say “above.”
Per Oxford Languages, an acronym deliberately formed from a phrase whose initial letters spell out a particular word or words, either to create a memorable name or as a fanciful explanation of a word's origin.


