


It’s April 8, 1993. We are back here at Cleveland Stadium. It’s the bottom of the 7th, and the Indians lead the Yankees 10-5. Yankee Starter Steve Howe has been removed from the game after allowing 4 runs in the inning. Steve Farr is tossing his warmups as Sandy Alomar Jr. awaits. Cleveland DH Reggie Jefferson is at second, RF Glenallen Hill is at first. Nobody out.
Steve Farr is ready. Sandy digs in. Let’s resume the bottom of the 7th inning here in Cleveland.
Alomar gets ahead in the count 2-1. He swings at the 4th pitch and lifts it high in the air to deep left-center. Dion James has it, and finally the 1st out of the home half of the 7th. Jefferson will tag and scoot over to the third. That’ll make it runners at the corners with 1 away.
Indians SS Felix Fermin is next. He’s the only Indian without a hit this evening. We’ll see if he can join the offensive barrage against Farr. He gets in an 0-2 hole, so he’ll have to battle for that first hit.
0-2 on the way . . . There’s a line drive . . . Caught out in right by Danny Tartabull! Hard hit and well struck, but it’s out number 2. That’s baseball!
Kenny Lofton will be the 9th Cleveland batter. Do we need to relitigate the “Batting Around” debate? Let’s just say that there are those who think the 10th batter of the inning is “Batting Around,” and then there are those that are wrong.
1-1 pitch on the way to the Cleveland CF . . . Groundball . . . Gets through the 5-6 hole! Jefferson comes to the plate. He scores! Glenallen Hill to second. It’s a 2-out, 1-run Single for Lofton and it’s now 11-5 Indians. The 5th run of this Cleveland Big Inning.
Alvaro Espinoza, who pinch-hit for 3B Jeff Treadway to lead off the inning, is back up . . . and how you couldn’t think this constitutes “Batting Around,” I’ll never know. He singled earlier off of Steve Howe. Let’s see if he can keep this Big Inning going!
Espinoza swings and misses for Strike 2. 0-2 the count.
How do we list Espinoza’s position in this scenario? He pinch hit to lead off the 7th. Is he still a pinch hitter?
0-2 pitch on the way. Foul ball. We’ll do it again.
I mean, he hasn’t taken the field yet, so a defensive position hasn’t been declared. Though you’d imagine he would stay in the game as the third baseman, as the 0-2 pitch is taken for a ball. 1-2 the count.
I bring this up because this doesn’t happen very often and I think it might be educational for all the listeners. We’ll get the research department on that as Espinoza looks at Ball 2 to even the count.
I mean, it would be ludicrous to say he’s still a Pinch Hitter, right? What is he pinch hitting for himself? So, it would seem to me . . .
. . .there’s Ball 3 to make the count run full.
That Espinoza is just positionless at this point. He is in a sort of “Statistical Limbo,” if you will.
The 7th pitch on the way . . .
And that ball’s hit well! Deep into left! Goodbye! It’s a 3-Run Home Run for Espinoza, the man without a position! The Indians now have a 14-5 lead here in the 7th! A Big Inning indeed!
Well, as if this inning couldn’t get anymore interesting. 2B Carlos Baerga will dig in for his second plate appearance of the inning. Off Steve Howe, a lefty, Baerga, a switch-hitter, batted from the right side of the plate and clubbed a 2-Run Homer. Now against Farr, a righty, Baerga will bat from the left side of the plate and will have a chance at history as Baerga looks at Ball 1.
Baerga could join some of the all-time greats like Willie McCovey, Al Kaline, and Joe DiMaggio if he hits his second Homer of the inning. That’s a club of 25 total members as Baerga looks at Ball 2.
But, Baerga has a chance here at becoming the charter member of his own club.
2-0 on the way to Baerga . . . And he hits this one well . . . Deep into right-center . . . At the wall . . .
THERE IT IS! Carlos Baerga has just made history with that solo shot! He has become the first player in Major League history to hit 2 Home Runs in one inning from both sides of the plate! Touch ‘em all, Carlos! This long trot will be remembered forever!
The Best of Both Sides
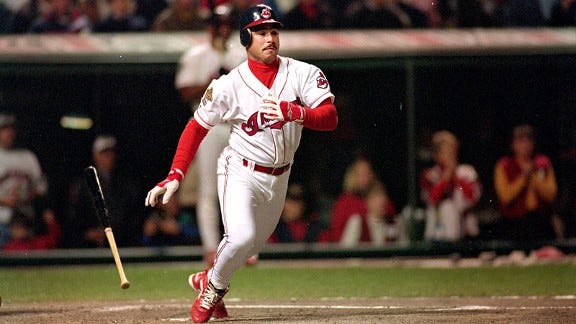
Okay, so maybe Carlos Baerga’s historic Home Run isn’t really remembered forever, but it probably should be. Why? Because Switch Hitters are really cool!
One of the aspects of baseball beloved by fans is its discrete nature, but that is also an aspect that can contribute to its “boring” label. “Batty McBatterson is a right-handed first baseman.” That’s all he is? Boring! Variety is the spice of life, and the same is true for baseball. Switch Hitters provide variety, and that makes switch-hitting cool. (Very scientific and analytic, I know!)
Baseball’s first Switch Hitter was Bob Ferguson, a third/second baseman from the 19th Century whose nickname was, apparently, “Death to Flying Things,” which alludes to his preternatural ability to nab liners out of the air. In 1870, Ferguson’s club, the Brooklyn Atlantics, did battle with the Cincinnati Red Stockings, widely regarded as the best team in the country. It was a tight contest between the two Base Ball (note the 2 words, not 1) clubs, knotted up at 5 runs apiece heading into extras. After the top of the 11th, Cincinnati took the 2-run lead. Brooklyn wouldn’t go quietly though, as they pulled the game to within one.
Ferguson came to the dish with a runner in scoring position. As the story goes, Ferguson, a natural right-handed batter, surveyed the defense and keyed in on Red Stockings SS George Wright, an elite middle infield glove. Wanting to keep a ball in play out of Wright’s range, Ferguson made the decision to dig in from the left side of home plate. Baseball games weren’t broadcast on the radio until the 1920s, but if this game were, then I’d imagine the call went something like this . . .
Ladies and gentlemen, we find ourselves in the bottom of the 11th inning here in Brooklyn, and what a contest it has been between the Cincinnati Red Stockings and the Brooklyn Atlantics. The score is 6-5 in favor of the club from Cincinnati. With a runner poised at second base, Bob Ferguson steps up to the plate. Remarkably, Ferguson, a natural right-handed striker, is taking his stance from the left side this time. A switch-hit! This is an unprecedented move, folks. Never before has a man switched sides in such a manner!
And there's the pitch! Ferguson makes contact! The ball is hit sharply down the first base line. Charlie Gould moves to field it, but oh, disaster strikes for Cincinnati! The ball slips through the wickets!
Joe Start is rounding third, he's heading home, and he scores! The game is tied, and the crowd is roaring with approval!
But wait, Ferguson is not content with two bags. He's digging for third base! Gould retrieves the ball and fires it to third, but it's a wild throw! The ball sails past the third baseman. Ferguson is racing home! Ferguson scores, and the Brooklyn Atlantics have won the game in the most extraordinary fashion!
The spectators are beside themselves with excitement! They’ve stormed the field in celebration! What an incredible ending to an historic game! Bob Ferguson, with his daring switch-hit, has etched his name into the annals of Base Ball lore. The Brooklyn Atlantics triumph over the Cincinnati Red Stockings in a thrilling affair! 7-6 in 11 innings!
Bob Ferguson’s decision to switch hit in 1870 was a strategic maneuver, but he didn’t always switch hit based on strategy. Sometimes, Ferguson would switch to the left side based on a “gut feeling,” which is about as baseball as it gets.
Today’s Switch Hitters do bat from both sides of the plate as a strategic maneuver, but their reasoning is much more refined than that of Bob Ferguson’s. Why do certain batters switch hit? To illustrate this, let’s say Clayton Kershaw is on the bump for the Dodgers, one of the greatest left-handed pitchers of all-time. Over Kershaw’s career, he’s held 10683 opposing hitters to a .209/.261/.324 Slash Line. Not great if you’re a batter.
In baseball, the handedness of a pitcher and the batted . . . ness . . . of a batter matters. If we consider how Kershaw performed by splitting his batters faced into two groups, Right-Handed Batters (RHB) and Left-Handed Batters (LHB), we have what is known as a Platoon Split. A Platoon in baseball is a system of player combinations that can be interchanged on any given day in a lineup so that batters face the opposite handedness in the opposing pitcher. Generally speaking, RHBs fare better against Left-Handed Pitchers (LHPs), and vice versa. A batter facing pitchers of the opposite handedness, or a pitcher facing same-handed batters is known as the Platoon Advantage.
When Kershaw held the Platoon Advantage, he held lefty opponents to a quite miserable .195/.247/.314. In fact, among LHPs who have faced at least 2000 LHBs in their career, Kershaw holds the lowest ERA (2.33), AVG Against, and OBP Against. Wise managers would often try to fill their lineups with righties against Clayton Kershaw, but it really wouldn’t matter. Righties hit just .212/.265/.326 against the Southpaw. Among LHPs with at least 8000 RHBs faced, Kershaw holds the lowest ERA (2.52), AVG Against, and OBP Against.
So, why does the Platoon Advantage exist? Why do pitchers fare better against same-handed batters? Imagine you’re a left-handed batter against Kershaw. Here’s what your view would look like from the batter’s box, using Baseball Savant’s 3D Pitch Visualization tool in Figure 1A below.

In green, you can see the ball at the point of release. The balls in yellow represent where the ball is 100 milliseconds after release. Purple represents 167 ms before the ball crosses the plate (known as the commit point). Notice how the green and yellow points seem to line up behind the LHB’s head. Only at the point where the batter needs to decide on swing or no swing, the commit point, does the ball seem to come in front of their eyes. Compare that to Figure 1B below, which depicts what it would look like as a RHB against Kershaw.

See the difference? Those green and yellow balls are starting out in front of the batter’s eyes, making the pitches much easier to see from the point of release, and thus easier to track as they approach the plate. When you’re a batter facing a pitcher with the same handedness you’re playing a guessing game. It’s hard to pick up on subtleties like spin and movement that might help you with swing decisions.
And this is where Switch Hitters can gain an advantage. Since they can swing from both sides of the plate, Switch Hitters always have the Platoon Advantage, giving them more opportunities to see the ball as it travels.
So, who’s the greatest Switch Hitter of all-time? Let’s look at Figure 1C below.

In it we see the career OBP and SLG of the 159 batters in AL/NL history with at least 1000 career PA from each side of the plate, at least that we are aware of–the completeness of Platoon Splits is only guaranteed for PA after the 1972 season. The overwhelming majority of batters seemingly fall in the big middle of that plot. However, there are three that stand out above the rest, with one clearly on top. Who is this man?
Well, it should come as no surprise to anyone who that player is. A generation of baseball fans adored the game because of him and he’s considered one of the greatest to ever do it, even to this day.
Enter Mickey Mantle.
You Take Me By the Heart When You Bat From Both Sides

Mickey Mantle’s journey to becoming the greatest Switch Hitter of all-time started when he was a young boy growing up in Great Depression Era Commerce, Oklahoma. Mick, a natural righty, would take batting practice from his grandfather, a lefty. When Mick’s father, a righty, would toss him BP, he encouraged his son to bat from the left side, believing his son would gain more opportunities to play in the professional ranks if he could always gain the Platoon Advantage. I think his dad was right.
When The Commerce Comet made his Major League debut in 1951, he was decently above average in 96 games, slashing .267/.349/.443 for a 117 OPS+. When the Yankees played the Giants in the 1951 World Series, Mantle faced a major setback in his young career, as he suffered a horrible knee injury while catching the rubber cover of a drain pipe with his spikes while running down a ball in the outfield. Mantle’s knee would never be 100% from there. But it didn’t matter.
Coming back from a major knee injury in 1952 and through the 1955 seasons, Mickey Mantle firmly planted himself in the discussion for the best player of the 1950s, slashing .303/.408/.542 for a 162 OPS+. Mantle received AL MVP votes for the first time in his career, but the crown of best player in the American League eluded him. In 1956, Mick managed to step his game up to unforeseen heights.
I’ve used the metric Wins Above Replacement (WAR) in passing in other articles. There will be full articles in the future that delve into its nuances and how it attempts to value players, but I will give a brief overview of WAR for those who may not be as familiar.
WAR attempts to estimate the value of a player compared to a replacement-level player. To place something concrete to that concept, you can think of replacement-level as the baseline performance you would expect from a player in Triple-A, the highest level of Minor League Baseball, if they were called up to the Major League roster.
By comparing every measurable component of a player’s game—batting, baserunning, defense, and the position they occupy on the field—to this baseline level of performance, we can estimate how valuable that player was to his team for a season or career in terms of Wins. After all, isn’t winning the primary objective of any team in a given season?
There are various ways to calculate WAR. For this Substack, I use Baseball Reference’s version of WAR, not because I think it’s strictly better than other versions, but because Baseball Reference is the primary source of data I use for my articles and is probably most familiar to my audience. With that out of the way, back to Mantle!
In baseball, the 5-Tools are typically thought of as Hitting for Average, Hitting for Power, Speed, Fielding, and Arm Strength. It would be fair to bestow the title of 5-Tool Player onto Mickey Mantle. In 1956, he slashed .353/.464/.705 for an OPS+ of 210. Remember, that means he was 110% better than the League average in terms of OPS. He led all of MLB in AVG, SLG, and OPS+. Oh, and he clubbed a League leading 52 homers with 22 Doubles and 5 Triples added as a cherry on top of the MVP Sundae. In terms of his Speed, you might first check his Stolen Base total of 10 and think he maybe wasn’t that fast. Mantle was certainly no Willie Mays (40 SB in 1956), but his 10 Steals put him above the MLB median (4 SB) among qualified batters in 1956. It should also be noted that he was only caught once, meaning his SB% of 90.91% was better than even the Say Hey Kid’s 80% success rate. For Speed, we need to look deeper.
Baseball Reference includes Baserunning stats for each player in their database. One particular metric I like to look at is Extra Base Taken Percentage (XBT%). This metric looks at times a player is on base and then calculates what proportion of the time that player took the extra base. So, for example, if Mantle were on 1st, the batter hit a Single, and Mantle advanced to 3rd, then that would be an Extra Base Taken (advancing more than one bag on a Single). Another common example would be scoring on a Double when you started at 1st (advancing more than two bags on a Double). In 1956, Mantle took the Extra Base 60% of the time, good enough for 10th in the Majors among qualified batters that season. Suffice to say, the offensive side of Mantle’s game was well-rounded and elite in every aspect. How about his defensive acumen?
There will be a future article on more advanced defensive metrics, so we’ll stick to the basics to examine Mantle. Let’s start with his counting stats. Mantle played 1261.2 innings in the outfield, all in center, for the 1956 season, which was the 14th most among all outfielders that year. He recorded 370 Putouts (7th among all OF) and 10 Assists (tied for 15th). Committing only 4 Errors, that placed his Fielding Percentage at .990 (2nd among all OF with at least 1000 innings). A simple rate metric devised by the grandfather of Sabermetrics Bill James is Range Factor per 9 Innings (RF/9), which is similar to a Pitcher’s ERA.
Doing that math on Mantle’s 1956 season, he made 2.71 plays per 9 innings, good enough for 9th that season among outfielders with at least 1000 innings. Suffice to say, the Comet could go out and get it!
When you combine the fact that Mantle was essentially twice as good with the bat as the average Major Leaguer, stole bases efficiently, took the extra base the majority of the time, had a glove and arm among the best in the Majors, and did all this while playing one of the toughest positions—center field—the Comet cemented himself as one of the most valuable players in the American League. Using Baseball Reference WAR, we get a pretty clear picture of just how historic of a season Mantle had in 1956.

Mantle’s 11.2 WAR essentially means that the Comet contributed 11 more wins to the New York Yankees that season compared to a Triple-A caliber player. To that point in AL/NL history, only 14 position players amassed 10 or more Baseball Reference WAR in a season. 1956 Mantle became the 15th player to join such elite ranks which contains a who’s who of Inner Circle Hall of Famers. His all-around greatness earned him a unanimous American League MVP award in 1956. After reaching such amazing and unprecedented heights, what would Mantle do in 1957? He did it again!

What more is there to say about Mantle that hasn’t already been said? Maybe, we get back to the meat of what this article is about? Ya know, the Switch Hitter?
Maybe the most interesting thing we can learn about Mantle is through examining his Platoon Splits. While play-by-play records for games from 1952 to 1972 are incomplete (Baseball Reference reports that around 1-2% of all PA from that timespan are missing), only 46 of Mantle’s 9907 career PA are missing from this sample. The numbers are presented in Figure 2C below.

We see the career Slash Stats for Mantle based on the Platoon Advantage, with the addition of a stat called tOPS+, which is the OPS adjusted to the player’s total OPS. Mantle’s tOPS+ of 104 as a RHB vs. LHPs means that his OPS within that Platoon Split is 4% better than his career OPS (.977). Conversely, his tOPS+ of 98 as a LHB vs. RHPs means his OPS in that split is 2% lower than his career OPS. Mantle’s claim of being a natural righty appears to be warranted, as his numbers certainly are better in that split. However, even as a lefty, Mantle was still an elite batter. Most players would kill to have that Slash Line for a career, period. If Mantle had those rate stats for his career, then his career OPS+ of 172 would be a slightly worse 169. This just helps reveal how elite Mantle was. Even from his “weaker” side, he was awesome. Then again, I don’t think that’s groundbreaking analysis.
Let’s go back to that scatterplot again. Two Switch Hitters came relatively close to matching Mantle’s greatness in terms of OBP and SLG over their careers. Who are they? If you’re like me, you try to guess before you learn the answer. My guess for “Number 2” was Braves 3B Chipper Jones and my guess for “Number 3” was Steady Eddie Murray.

Huh . . . Well, I was close with Chipper Jones, but missed the mark with Eddie Murray. I rattled off a couple more guesses for Number 2. Two more fearsome Switch Hitters of my era are Mark Teixeria and the perpetually underrated Jose Ramirez. Close, but nope again!
When I revealed the answer to myself, I gotta admit that I was kinda shocked at first. Going back through this player’s resume, however, reminded me just how good this dude was, and how underappreciated he was.
I can already feel my hips gyrating.
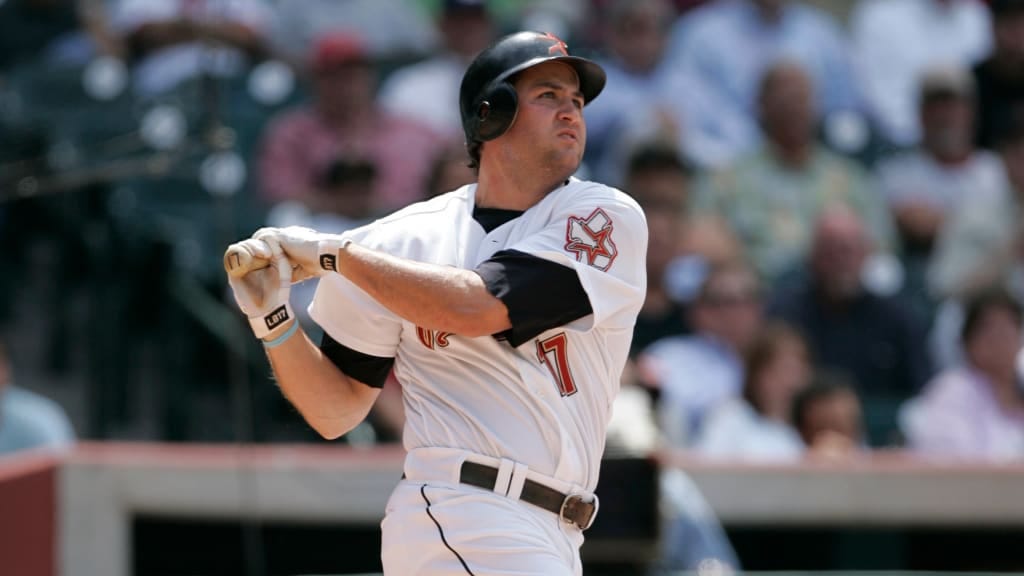
Enter Lance Berkman.
Lord Almighty, Feel My OPS Rising
Before we learn a little bit more about Lance Berkman, I must admit something about one of my flaws as a baseball fan: I am handedness blind. Give me a player at random and ask me to tell you off the cuff which side of the plate they batted from, and I probably won’t be able to tell you. There are exceptions, of course. Albert Pujols was a righty, Ken Griffey Jr. was a lefty, and Chipper Jones swung both ways . . . at the plate, that is.
When I conjure up an image of Lance Berkman, I can remember two things: One is Berkman as an Astro, climbing up Tal’s Hill in Houston to make an unreal catch over his shoulder. The second is him as a Cardinal in Game 6 of the 2011 World Series, collecting a two-out, game-tying Single in the 10th–from the left side of the plate. Based on that alone, I would have said for sure he was a left-handed batter exclusively. Sound off in the comments about how this discredits me as a baseball historian and statistician!

When I delved into Berkman’s career, I was reminded of how exceptional he was. Over the course of his 15 year Big League career, he ranked 13th in HR, 5th in BB, 6th in OBP, 13th in SLG, 8th in OPS+, and 13th in WAR. You could make an argument that Lance Berkman was a Top 15 batter, maybe even Top 10, in MLB over the course of his career. When compared to his fellow switch hitters, he was really only rivaled by the aforementioned Chipper Jones and Mark Teixeira, and Carlos Beltran. The argument could be made that he was the best switch hitter of his era.
In 2019, Berkman landed on the Hall of Fame Ballot for the first time. Unfortunately, the BBWAA voters didn’t deem him worthy of further consideration, getting only 1.2% of the vote when a player needs at least 5% to stay on the ballot. Looking back, I wish they would have reconsidered.
To be the second best Switch Hitter of all-time, Berkman had to have been like Mantle in his Platoon Splits–better from one side, but still basically even, right? Check out Figure 3B below.

Oh . . . Let’s break down what we see here. As a lefty, Berkman owned right-handed pitchers. If the .300/.400/.500 Slash Line isn’t good enough for you, then check his 111 tOPS+, which indicates that his OPS within this Platoon was 11% better than his career OPS. But as a righty facing southpaws? Yikes. A 66 tOPS+ indicating that his performance in this Platoon was 34% worse than his career norm. Note the reduction of 44 points of AVG, 60 points of OBP, and 158 points of SLG when Berkman switched to the right-handed batter’s box.
Let’s do some simple math to put this into perspective. Let’s imagine that Berkman’s performance as a lefty was a player’s career Slash Line over the same time frame as Berkman’s career, when the League average in OBP and SLG were .340 and .431, respectively. The OPS+ math comes out to 157. That is eerily similar to hitting like Frank Thomas, a slam-dunk Hall of Famer, whose career Slash Line was .301/.419/.555, good enough for a 156 OPS+.
What about Berkman’s performance as a righty against lefties? The OPS+ math comes out to 103. Remember, for OPS+ 100 is average. Yes, 103 does indicate 3% better than average, but it’s basically average. That’s similar to hitting like Dave Hollins, a switch hitter himself, who slashed .260/.358/.420 with a 106 OPS+ over his 12 year Big League career.
Lance Berkman as a lefty against righties hit like a First Ballot Hall of Famer. When he switched to the opposite side, he was average. To be clear here, this is not a knock against Dave Hollins or being a League average batter. Average in most walks of life is typically a diss. In baseball, being average is actually quite valuable. Most front offices would be very happy with average production from many of their lineup spots.
I think what this reveals is that switch hitting, while advantageous, is very difficult, and only a select few can truly make it work in an approximately equal way from both sides of the plate.

When examining the switch hitters with at least 1000 career PA from both sides of the plate, I took the difference of their OBP and SLG from the left side and right side. What you see in Figure 3C above is each switch hitter’s rate stat as a lefty minus that as a righty. Positive in any differential indicates a better performance as a lefty for that rate stat, and negative implying better performance as a righty. As previously discussed, we see Mickey Mantle relatively close to the center, as expected because he was roughly equal from both sides. Mantle is also in the bottom left quadrant, which helps reinforce the claim that he was a natural righty. Certainly, his right side had more slug.
But then, there are guys on the outskirts like Dave Hollins and even Lance Berkman who seemed to get dramatically worse when they switched to their weaker side. It makes me question if the Platoon Advantage was really worth it. Should Lance Berkman have just strictly been a left-handed bat? What would his production have looked like if instead of facing left-handers from the right side of the plate, he accepted the Platoon Disadvantage and batted from the left side?
To answer this question, I used Stathead, Baseball Reference’s incredible querying tool that allows losers (I mean . . . enthusiasts) like me to search mounds of data Baseball Reference has at its disposal. I found left-handed batters similar to Berkman’s performance against right-handed pitchers. They needed to have at least 1500 PA against righties, and be within 20 points of Berkman’s .420 OBP against RHP and 40 points of his .575 SLG against RHP. Below in Figure 3D you’ll find the 9 players who meet this criteria.

To estimate Berkman’s performance against lefties if he committed to being strictly a left-handed bat, I calculated each player’s difference in OBP and SLG by platoon split (using vs. RHP minus vs. LHP). I calculated the mean difference and standard deviation for each. Figure 3E summarizes those findings.
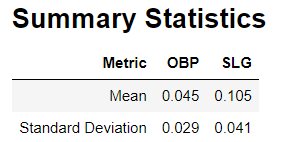
I constructed a 95% confidence interval for the true mean difference in each rate stat. I won’t bore you with the gorey mathematical details, so I’ll summarize it all by saying that I am using the mean differences in OBP and SLG as my point estimates, then adding and subtracting a margin of error to give me a range of plausible differences in OBPs and SLGs against lefties for similar left-handed batters. I took those bounds and subtracted them from Berkman’s performance as a LHB vs. RHPs to estimate a range of plausible OBPs and SLGs for Berkman as a LHB vs. LHPs. The results are summarized in Figure 3F below.

I will summarize what we’re seeing. I am 95% confident that, for LHBs similar to Berkman in terms of the lefty versus righty split, their true OBP and SLG as a lefty versus lefties is between the lower and upper bound for each rate stat. I have also included his performance as a righty versus lefties for comparison. I believe I have reasonable evidence to suggest that, theoretically, Berkman could improve his Slugging Percentage by at least 22 points, possibly as much as 84 points of Slug. There’s inconclusive evidence that his OBP would be better off. It’s possible it could drop by 7 points. If those 1825 PA Berkman took as a right-handed bat against southpaws were converted over to these estimates, he might lose 12 to 13 times on base at the expense of gaining about 40 total bases.
In this worst case scenario, it would probably affect Berkman’s overall performance only marginally. He’d be close to the same hitter he was if he stayed switch hitting. In the best case scenario, he’d be in consideration for the best hitter of his era. Would it be worth it?
It would be wrong if I didn’t point out that this inference is made with a lot of broad-sweeping assumptions that probably shouldn’t be made. Should Tris Speaker really be included in this sample? No, probably not considering his first 13 seasons were played within the Dead Ball Era of the sport. Do I think his inclusion makes the results more fun? Yes, and ultimately this newsletter is all about having fun with baseball analysis.
Even if this inference were 100% solid, it’s important to remember that this is merely an estimate that’s predicated on the fact that Lance Berkman would be comfortable with losing the platoon advantage. Like Mickey Mantle, Berkman switch-hit from a young age because his father demanded it of him. This was something he did for basically the entirety of his baseball career. I can’t imagine he’d suddenly feel good about facing lefties from the same side. It’s unrealistic. Even if he could pull this off and perform at the best case scenario against lefties, it would likely come at the cost of some really subpar production for a few seasons. If this was a decision he made, say, at the minor league level where the stakes are much lower, then maybe he could have pulled this off.
One thing in Berkman’s favor, if he had decided to commit to his better lefty side, is that lefties have the platoon advantage more often than pure righties. Over the course of Berkman’s career, 9495 pitchers made appearances in MLB games. 6889 of those pitchers were righties. That’s 72.6% of all pitchers from 1999 to 2013 tossing with their right hand. Switch hitting, natural right-handed batters will give up their platoon advantage more often. Let’s go back to Dave Hollins, who as discussed was a fairly average Big League bat over the course of his career. Maybe facing right-handers as a lefty, even though it was his weaker side, was the edge he needed. If he just wasn’t comfortable facing righties on the same side, his splits could look even worse, and then he’d be a below average player.
Instead, I’ll settle with my estimates for Berkman as a pure lefty as a mere dream of what could have been. The greatest left-handed hitter of a generation who became a slam-dunk, first ballot Hall of Famer. But, maybe, Lance Berkman would just be less cool as a non-switch hitter. It’s probably better off as a dream than reality.
While it hasn’t happened often, this “dream” actually has become a reality. Some players in MLB history have turned off the switch in the middle of their careers. In fact, there was a fairly recent success story.
Enter Cedric Mullins.
Cedric Mullins, Entertain Us!
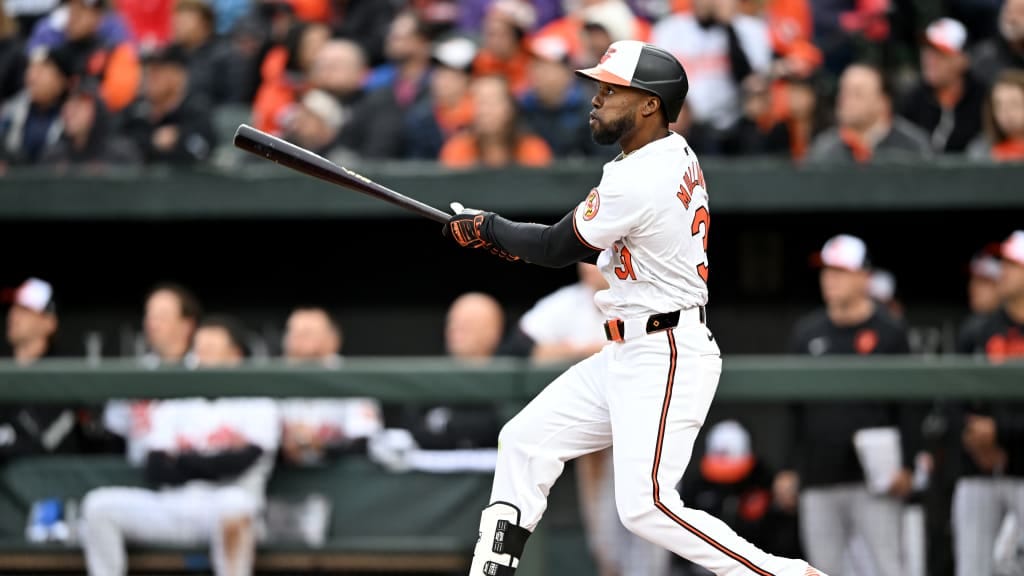
Drafted by the Baltimore Orioles in the 13th round of the 2015 Amateur Draft, the switch hitting centerfielder Cedric Mullins made his MLB debut on August 10, 2018 in a home game against the Boston Red Sox. With the Birds down early to the Sox in the bottom of the 2nd, Mullins came up for his first Big League PA against righty Nathan Eovaldi, who was on the ropes after allowing a solo homer, a walk, and a single before Mullins came to the left side of the dish. With the score at 3-1 in favor of Boston and facing a 1-1 count, Mullins sat dead red, as Eovaldi threw his 4-seam fastball around 40% of the time in 2018. Mullins roped one down the right field line for a 1-run double to make the score 3-2. The Campbell University Camel had his first Major League hit in his first Major League plate appearance (sports really could use more even-toed ungulates as mascots). A truly exciting moment for himself and his family in attendance at Camden Yards. The future looked bright for the number 9 prospect in the Orioles’ system.
From 2018 to 2020, Cedric Mullins took 418 PA. He slashed .225/.290/.342 for a 72 OPS+. Yikes. What happened?
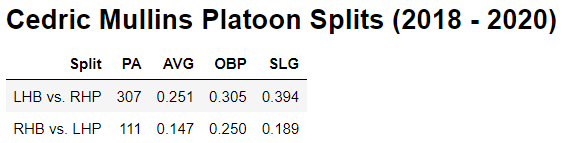
As a left-handed bat against right handers, Mullins wasn’t setting the world on fire exactly. That OBP and SLG would amount to an 89 OPS+. But, man, his performance as a righty against lefties was abysmal. There’s not a lot of data here, only 111 PA as a RHB is about a sixth of a full season of PA. Still, the disparity in being able to hit, period, is noticeable. Looking at his Statcast numbers, it’s clear he wasn’t hitting the ball hard from the right side. 20.3% of his batted balls were hit with an exit velocity of 95 mph or higher from the right side compared to 29.9% from the left side. Heading into the 2021 season, Mullins made a bold decision. He quit being a switch hitter and committed to strictly being a left-handed batter. Using the method I used for Lance Berkman’s theoretical OBP and SLG, I found that Mullins’ theoretical OBP would land between .277 and .301 and SLG between .339 and .370 batting left-on-left. He totally outperformed all expectations.

Cedric Mullins’ 2021 season was a bonafide breakout. He slashed .291/.360/.518 for a 137 OPS+, all while playing solid defense in center field. He was an All-Star, a Silver Slugger, and finished 9th in MVP voting. His hitting combined with his solid performance with the other tools earned him 5.9 WAR, when he had accumulated -0.3 WAR in 2018 through 2020 combined, meaning he was below replacement-level.
In Figure 4B, note the sOPS+ column. That’s OPS compared to the League average for that particular split. Was Mullins worse against lefties than righties? Yeah, without a doubt. You don’t need the 81 tOPS+ to tell you that. But, when compared to the rest of the League? 39% better than the League average for that particular split. It should be noted that sOPS+ is not park adjusted, which is probably worth noting since Mullins was a lefty playing home games in the friendly home run confines of Camden Yards and played 9 games on the road with the short right field porch in Yankee Stadium. It also bears mentioning again that, if you’re a switch hitter better from the left side, then that’s the preferable side to be better at since you see the platoon advantage more often on your stronger side. Regardless, Mullins made a gutsy decision!

Mullins has come back down to earth a little bit in the platoon disadvantaged matchup, getting fairly close to my confidence interval estimation. However, maybe having dedicated to one side, it has helped Mullins lock in on owning the platoon advantage. He’s been a slightly above League average batter from 2021 to 2023. He’s not having the best 2024, but as the weather warms up in Maryland maybe so too will Mullins’ bat.
The case of Cedric Mullins reveals one of the aspects of baseball that continue to draw me in: maximizing every fine detail to find whatever advantage you can. Mullins saw an inefficient part of his game, or something that he could capitalize on, not dissimilar to Bob Ferguson a century-and-a-half before. He made the tweak and, boy, did it work. However, there might be a downside to tinkering and the quest for efficiency.
THE OFF SWITCH

In the MLB Sunday Leadoff game on May 26 between the Blue Jays and Tigers, former World Series champion Joe Carter was in the booth as an analyst. Tigers rookie breakout and switch hitter Wenceel Pérez was at the plate and Joe Carter lamented how the switch hitter was on its way out of baseball. Figure 5A certainly seems to indicate that the trend is downward for qualified switch hitters. It had been on the rise from the 1950s into the 1990s. But into the Aughts, it’s been on its way down. Is the switch hitter on its way out? Should we savor the last moments we have with those that can bat from both sides?
Before we answer that, we should maybe get at why switch hitters might be on their way out of the game. As illustrated by Berkman, Hollins, and Mullins and their exaggerated platoon splits, switch hitting is really hard. A natural righty myself, I’ve taken swings lefty in a batting cage before. I could make contact, but it wasn’t pretty. (It’s arguable my right-handed swing isn’t pretty, either.) Could I work at my lefty swing and make it better? Sure, as any Big Leaguer could and do more efficiently than me. But the effort that goes into keeping two different swings in good shape might be better used on other aspects of the game that would make you better. There is also probably an aspect of coaching in the youth game that deemphasizes that skill because it is tough to teach. There have been ballplayers who have taught themselves to switch hit in the middle their pro career, but it’s incredibly rare. It’s not a skill that you can just pick up on the fly.

As we examine the trends, it would be worth examining just how many qualified hitters, period, there are. As we entered the Aughts, the number of qualified hitters has actually trended down. So if we’re going to say that switch hitters are on their way out, then maybe we should also say qualified hitters are on their way out. Obviously, that will never happen.

If we look at the 5-year rolling average of the proportion of all qualified hitters who switch hit, starting at the turn of the millennium, we’re talking about hundredths. We’re floating around 13 to 14% of all qualified hitters batting from both sides. It’s certainly down from the late 1980s and early 1990s where we saw basically a quarter of qualified batters switch hit. It’s possible that the switch hitter is on the way out, but I’m not alarmed. Why?

Figure 5D shows the qualified switch hitters in 2024 with at least a 90 OPS+. We have a lot of switch hitters right now who are balling out!
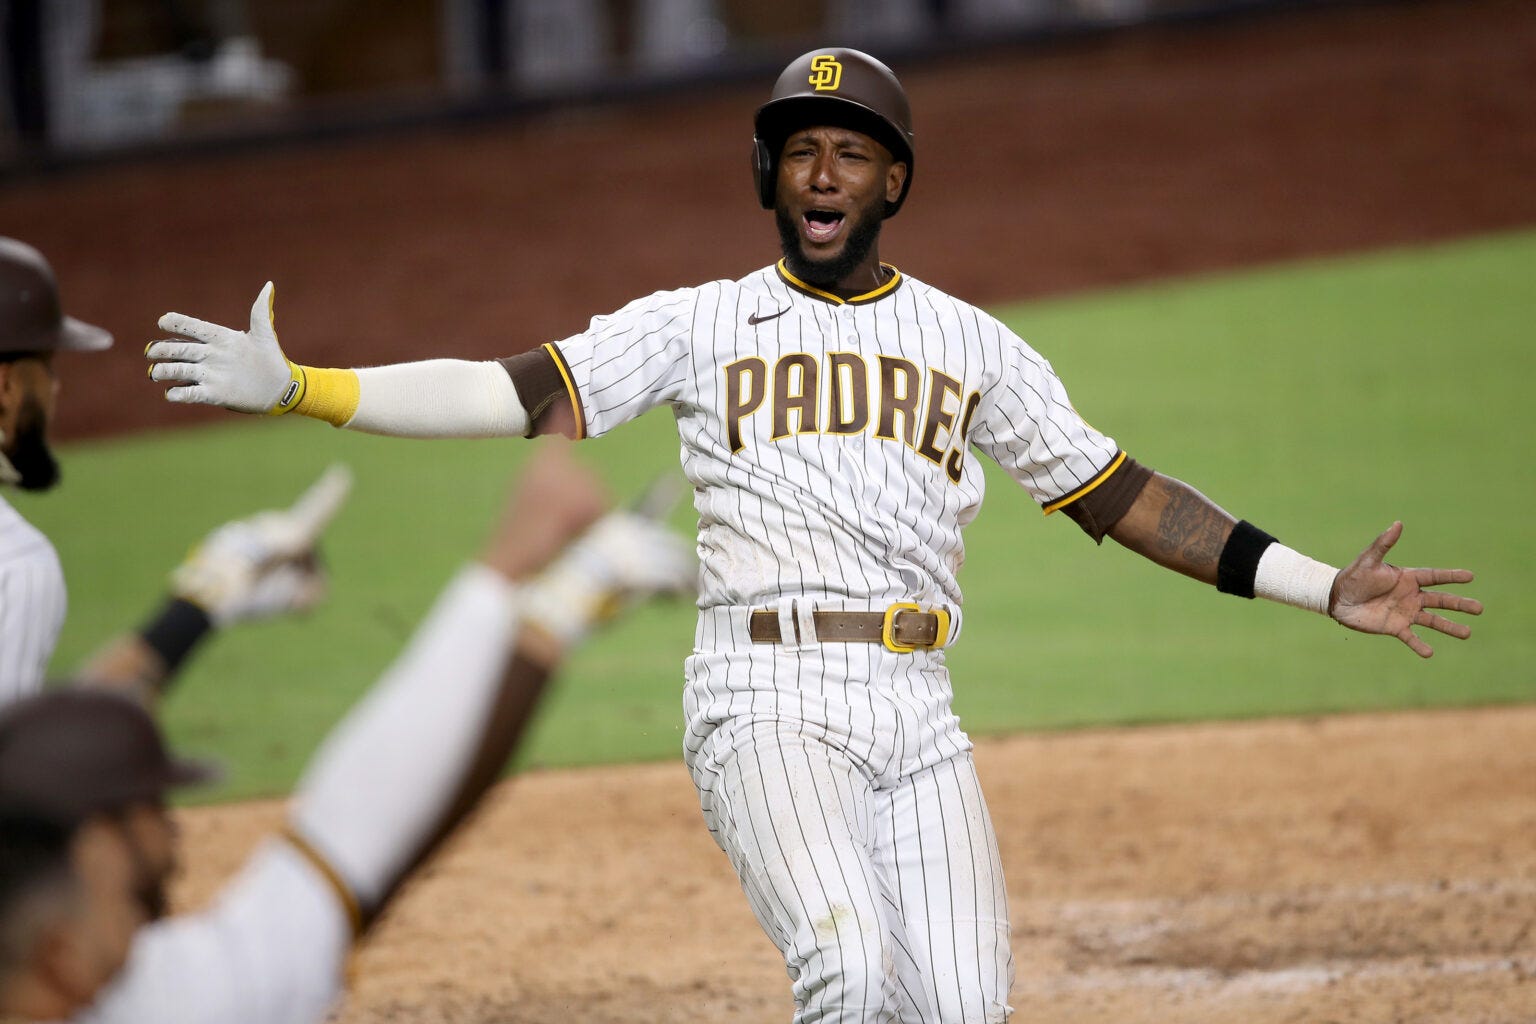
I thought Jurickson Profar was done, but he’s been keeping that Padres team in contention for a Wild Card spot.
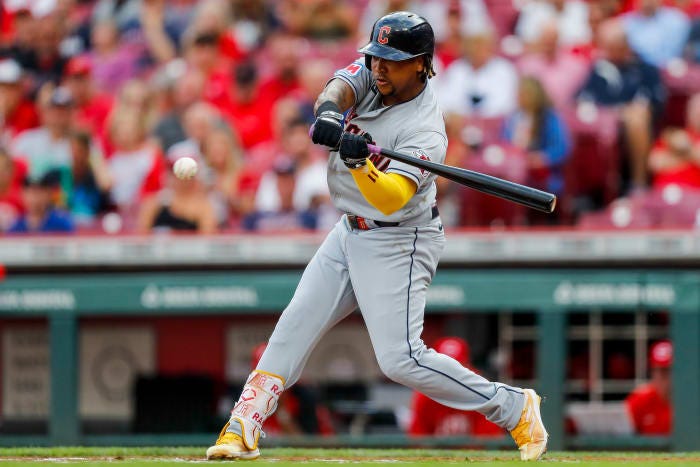
Jose Ramirez remains a thorn in my Twins side, and he’s secretly one of my favorite players in the League.
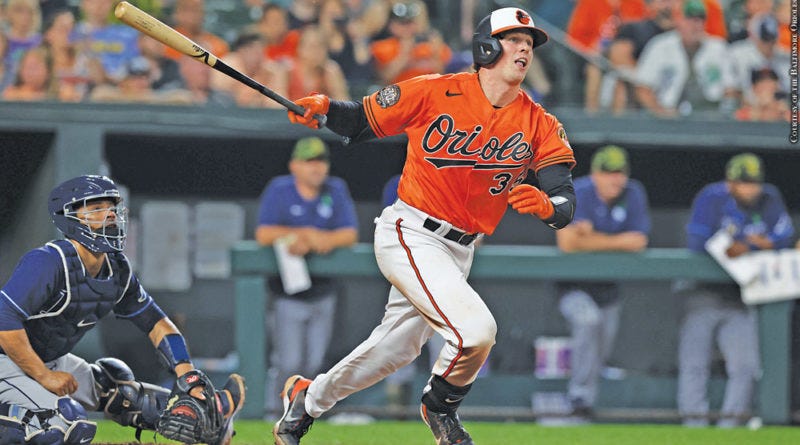
Adley Rutschman has a strong case for the best catcher in Major League Baseball.
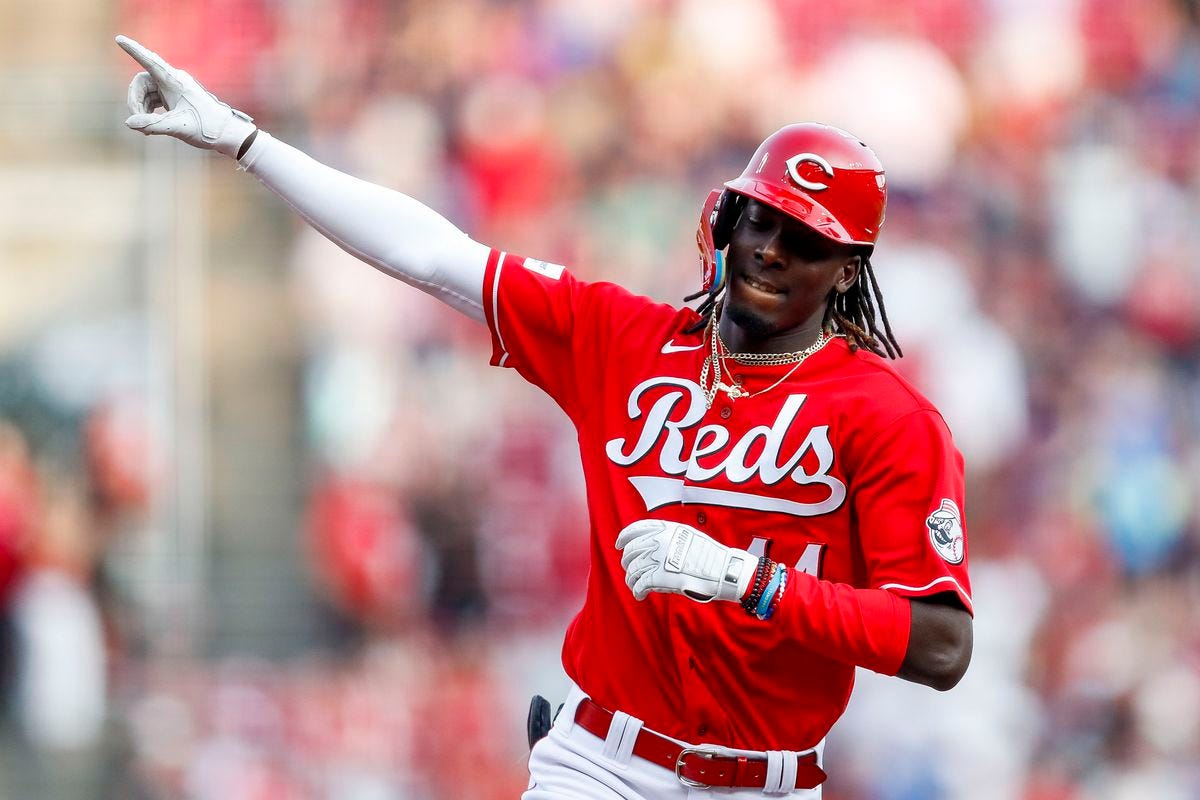
Speaking of strong cases, Elly De La Cruz might just be the most thrilling man in the game today.
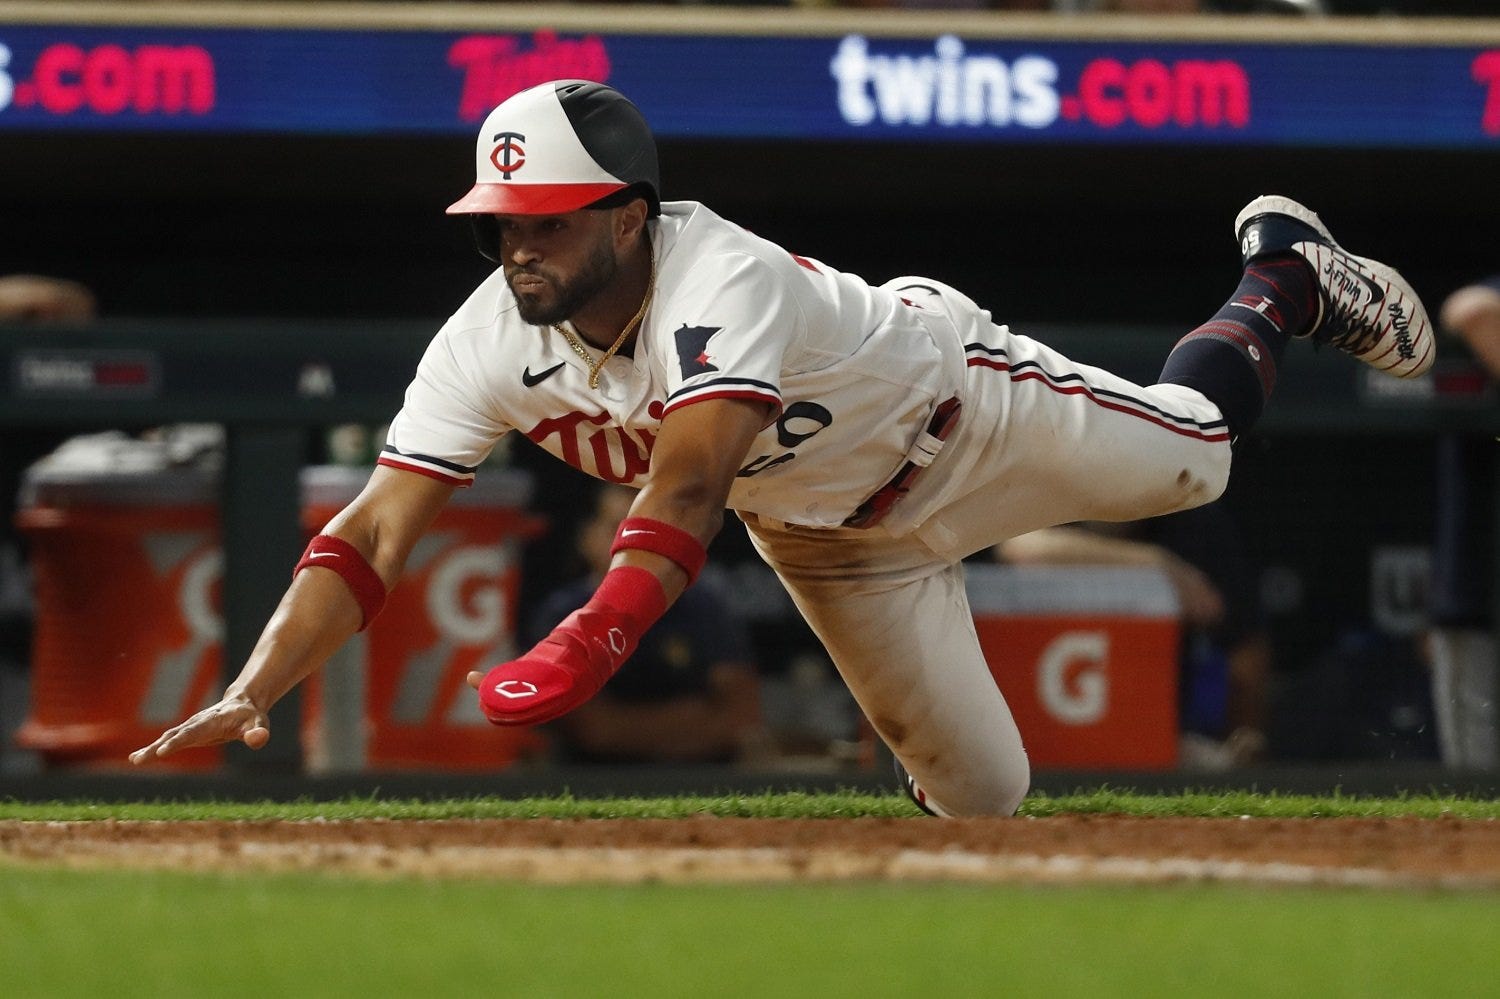
Willi Castro is my favorite Twins player right now. He can play anywhere on the diamond. Love utility players! (Variety is the spice of baseball, remember?)
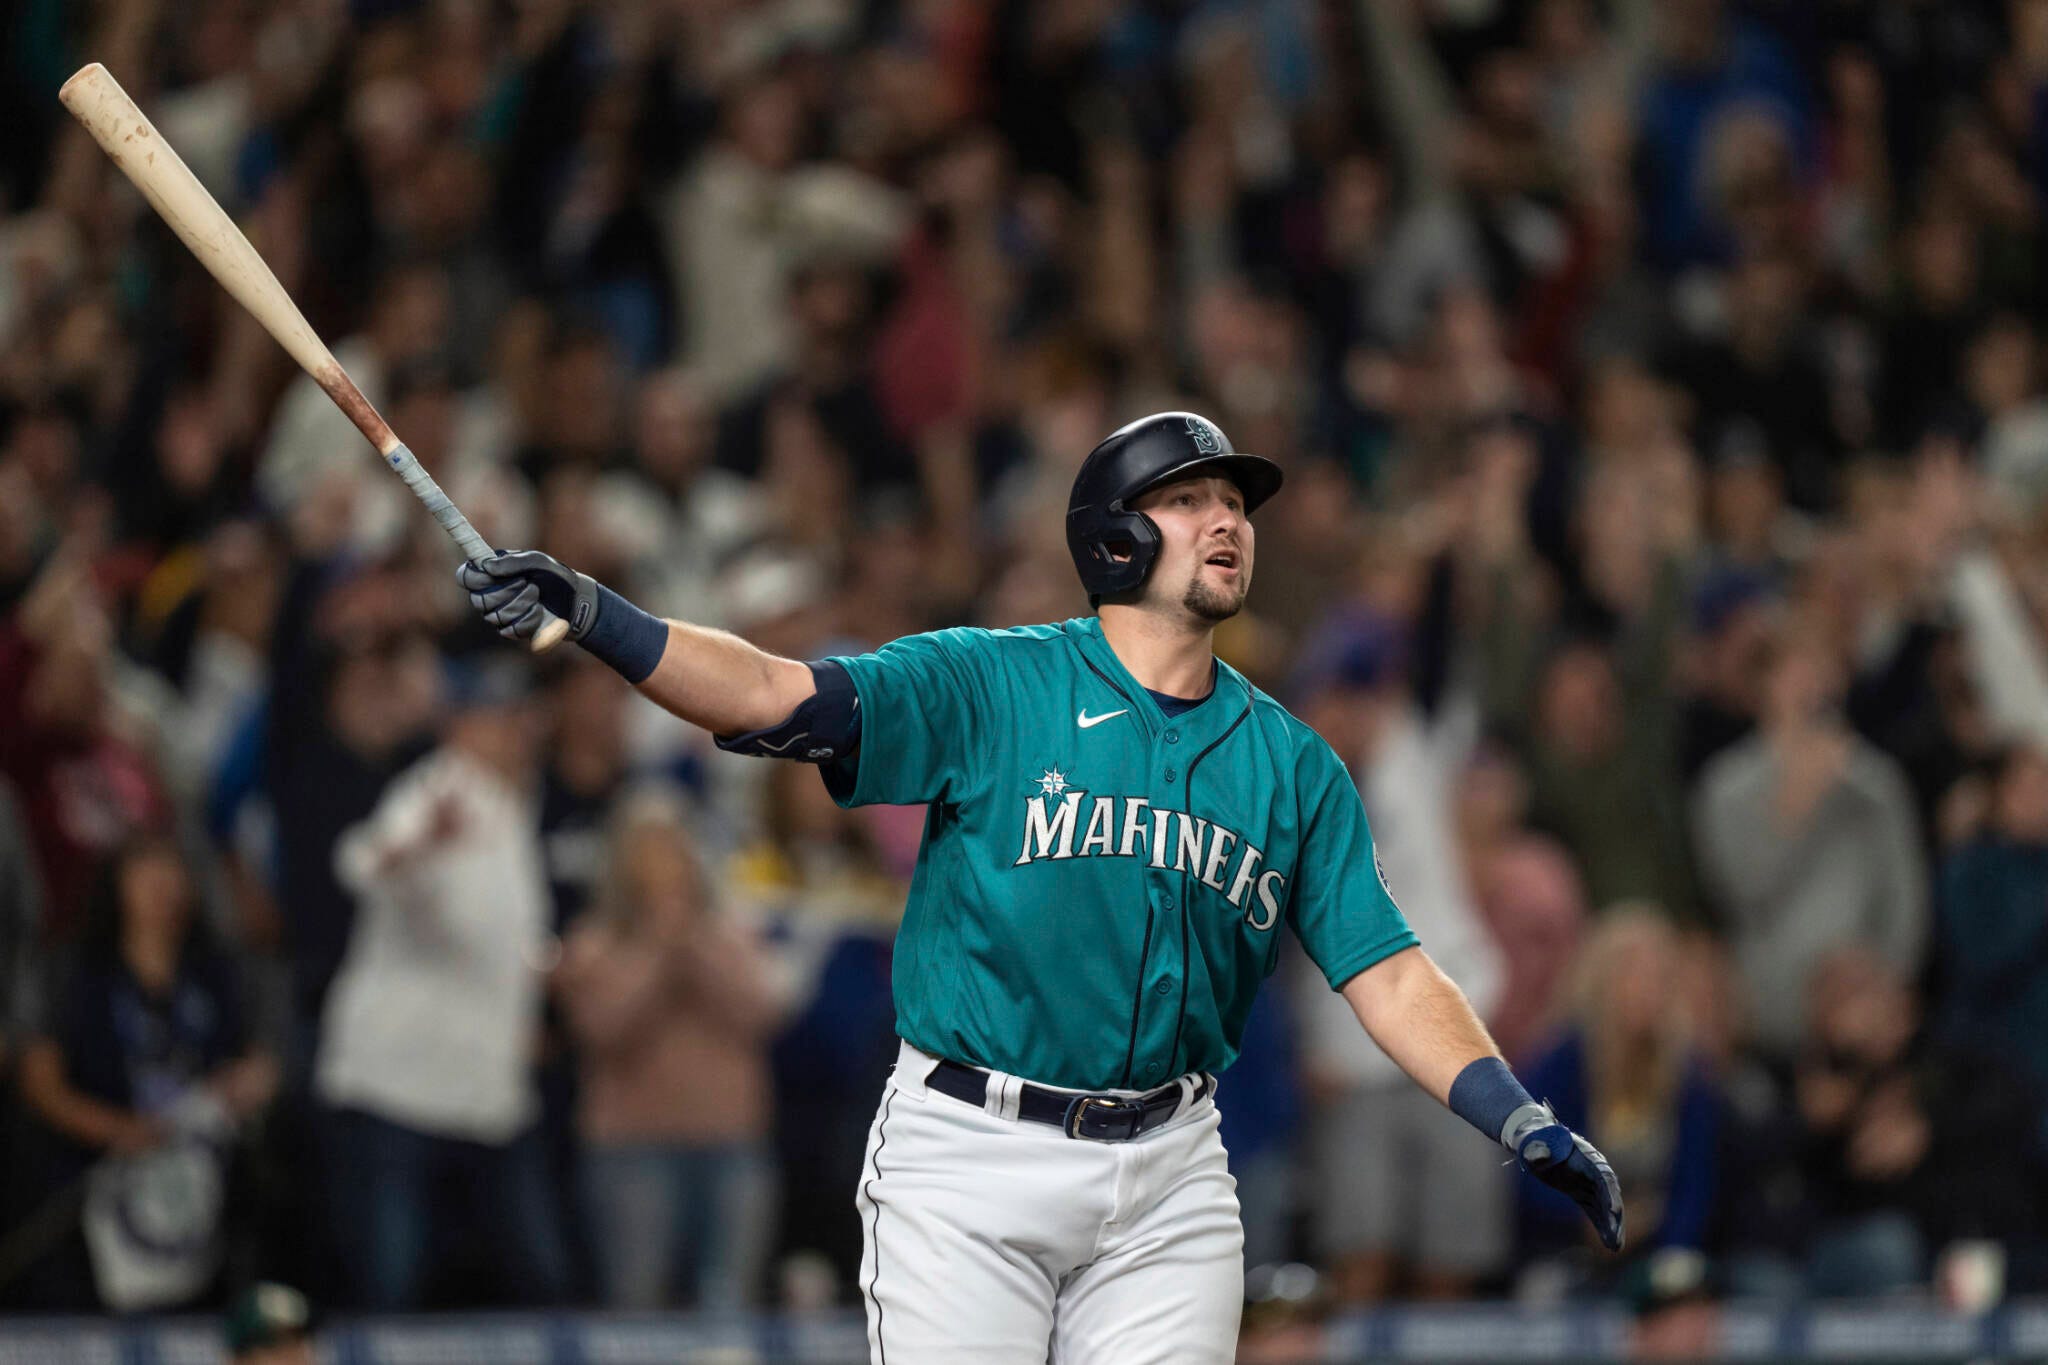
And then there’s Cal Raleigh, whose nickname is The Big Dumper. Nuff said there!
Even the guys who are a little below League average have great stories to tell. Leody Taveras is an excellent defensive center fielder for the reigning champion Texas Rangers.
Blake Perkins is a young, rising star for a Brewers squad that has defied expectations.
Ian Happ has a podcast and is spreading the love of the game to the younger generation of MLB fans.
Where I am going with all of this is that, while we might not have very many switch hitters at the moment, the ones we do have are fun. The game still has the human side of it. These are ballplayers, but they are also people with rich stories to tell. The switch hitters in this list make the game more exciting to watch, and might inspire future generations of ballplayers to switch hit. Sometimes, quality over quantity is better than vice versa. Switch hitting is cool, and the switch hitters we do have are even cooler.
Thanks!
Thanks for taking the long trot. To be a switch hitter in Major League Baseball means you’re a part of a melting pot of talent that helps tell the story of the game.
Special Thanks go to Baseball Reference, their Stathead product, and Baseball Savant for making baseball data accessible for us all.
And of course, Special Thanks go to the Commerce Comet, Fat Elvis, the Entertainer, and all of the other switch hitters before them, in the game currently, or on their way up to the Big Leagues. Your presence in the game of baseball makes it that much more exciting.


