


Harold’s Choice
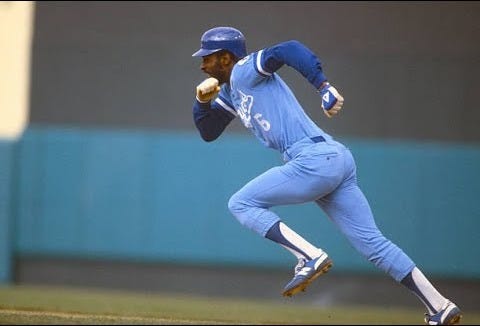
When you think of Bo Jackson, what do you think of? Maybe it’s his leadoff Home Run in the 1989 All-Star Game? Maybe it’s his throw to nab Mike Gallego at third base from right field? Or the time he robbed Jack Clark of a Home Run? Or that time in Baltimore when he got on his horse, made a spectacular running catch, then scaled the wall like Spider-Man? Or when he broke his bat over his helmet? Or, maybe, you remember his career as a professional football player?
Whatever your memory may be, the whole point of the question was to illustrate that Bo Jackson’s career was mesmerizing. His very presence on the diamond or gridiron captivated fans because of his freakish athleticism and tools. If a committee were tasked with picking an Athlete of the 1980s, then Bo Jackson might be the unanimous selection.
Now, when you think of the career of former Mariners second baseman Harold Reynolds, what do you think of? Some might remark, “Wait, you mean that guy on MLB Network? He had a playing career?” Well, yes, Harold Reynolds certainly did have a Major League career. He played parts of 12 seasons, mostly with the Mariners, from 1983 to 1994. Maybe it wasn’t a memorable career when compared with Bo Jackson, at least by the whole fame thing, however, for those who do remember his playing career, this moment might be the first that comes to mind—a play that forever links the seemingly polar-opposite careers of Bo Jackson and Harold Reynolds.
The Mariners would fail to score in the 10th inning and would go on to lose the game, 5-3 in 13 innings. However, none of that mattered. The highlight of that game came down to about 3 seconds of real time action. It’s a play that has been remembered fondly for roughly 36 years after it happened. The YouTube video of this play has over 3.5 million views and features comments like, “That’s the greatest throw ever!”
However, I’ve often wondered if Harold Reynolds actually made the right choice. Sure, Bo Jackson’s throw was spectacular, but should Reynolds have tried to score, or should he have held up at third? To explore this topic, I used the Swiss Army knife of Sabermetrics: The Run Expectancy Matrix.

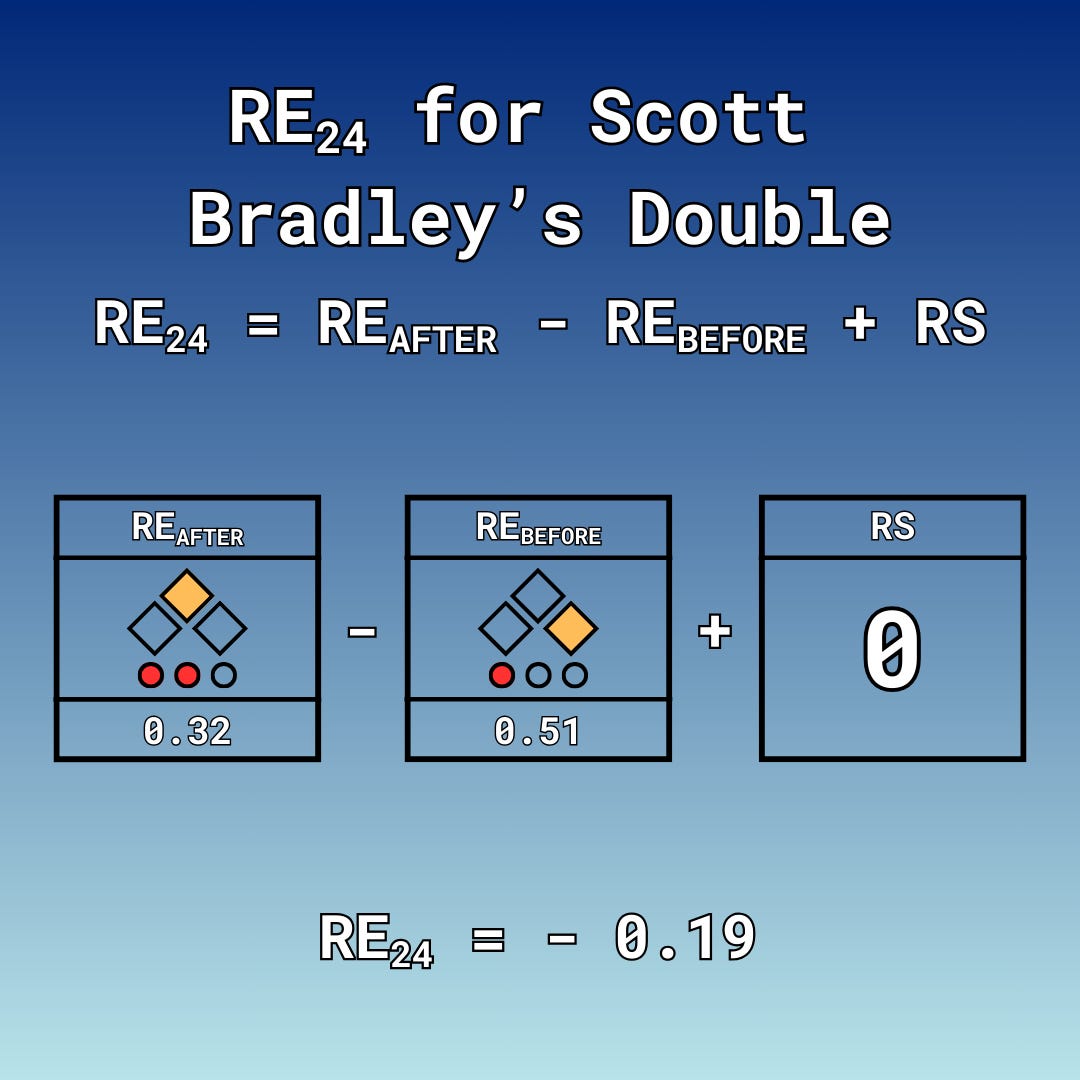
To quickly recap, the Run Expectancy Matrix tells you the expected number of runs scored until the end of the half-inning for a given base-out state. The one I will be using in this article covers the 1980s, specifically, and was created with the help of Greg Stoll’s Win/Run Expectancy Calculator. With Scott Bradley at the plate and one out, Harold Reynolds was on first base. Based on the matrix in Figure 1A, the Mariners would expect to score 0.51 runs, on average. To communicate the change in run expectancy, the metric I’ll be using is known as RE24, which is essentially just net run expectancy.

After Reynolds was gunned down at home, Scott Bradley was at second base with 2 outs. Per the matrix, that means that the Mariners would expect to score 0.32 runs from this position. Using RE24, we see that this play resulted in a net run expectancy of . . .
The Mariners weren’t in a great spot in terms of their run scoring potential in the aggregate. Yes, Scott Bradley was in scoring position, but with 2 outs it becomes harder for him to cross the plate. This is what got me thinking about the whole question of whether Harold’s Choice was correct. How would things have changed if he decided to not test the arm of Bo Jackson–who, by the way, had already amassed 20 OF Assists in the 2 seasons prior to 1989. By default, Scott Bradley’s Double would end with runners at 2nd and 3rd, 1 out. In that scenario, the run expectancy lands at 1.37. That number alone makes holding at third pretty enticing. Situationally speaking, the Mariners would be expected to score.
However, this isn’t just any run. It’s the winning run! If Harold scores here, then he and Scott Bradley are Mariners heroes. (Okay, that might be a bit much for a team three games below .500 in the month of June.)
To estimate the success rate Harold Reynolds would need to justify the decision to attempt to score, I’ll use runners at second and third with 1 out as the starting point, as it represents the bare minimum expectation. Scott Bradley advanced two bases, so too should Harold Reynolds by default.
From there, we have two paths the play could go down. I’ll start with what actually happened: Harold Reynolds is gunned down at the plate. Using runners at 2nd and 3rd, 1 out, as the starting run expectancy, the net change in run expectancy comes to:

It’s a pretty substantial shift if Harold Reynolds doesn’t score there. But, again, the game is tied in extras. Reynolds scores, and the game is over. It makes sense to go for it. What if he had been successful? We still calculate the run expectancy in the same way, even though the play would end the game. The run scoring would make it runner at 2nd, 1 out, which is a run expectancy of 0.67.
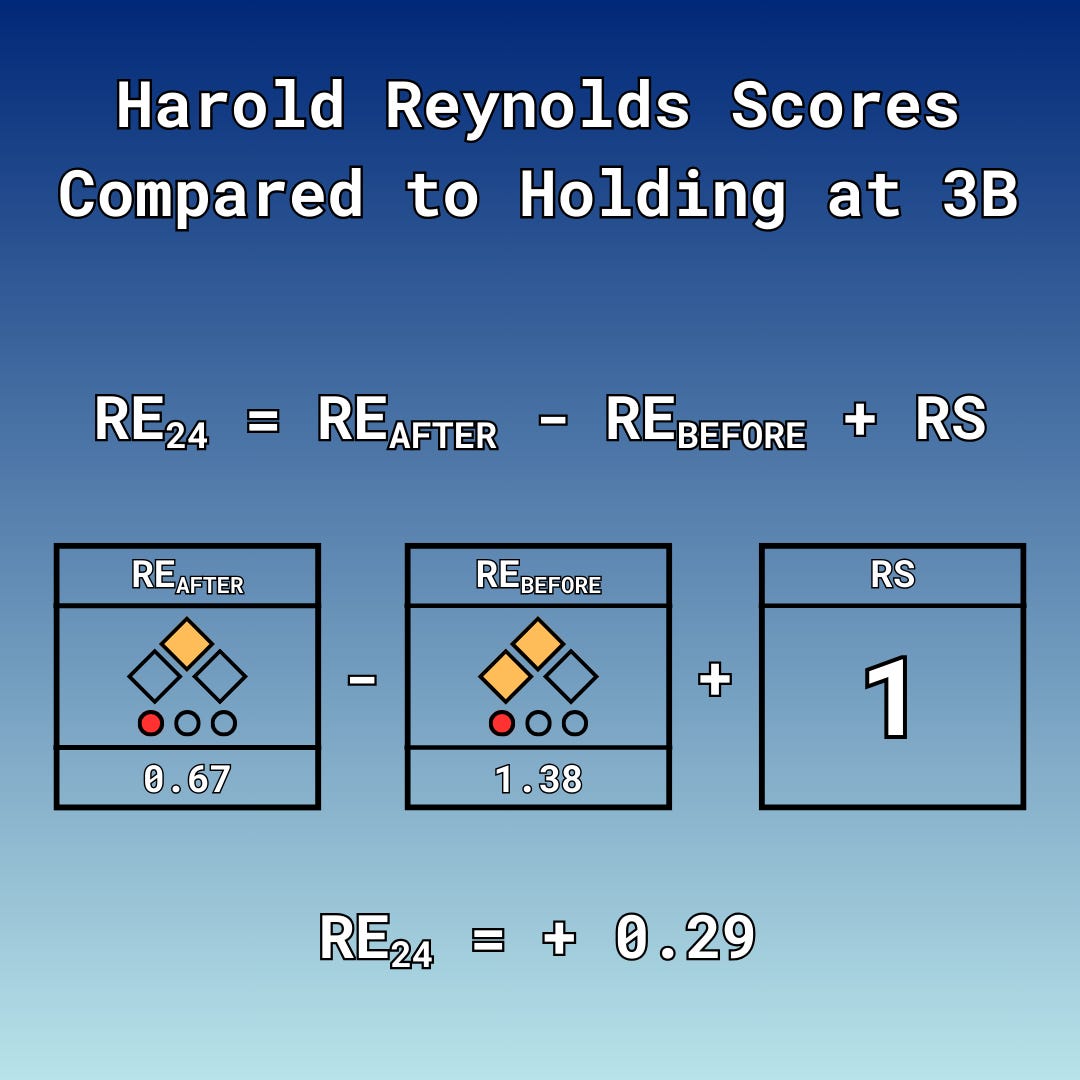
For those that might be skeptical of this number, remember that it really just communicates how much of the run Harold Reynolds adds by taking the extra base compared to the baseline expectation of holding at third base. Bradley’s Double, by default, would make it second and third with 1 out, adding 0.87 runs. The 0.29 runs essentially represents how much taking the extra 90 feet and scoring is worth. From there, we can see the success rate Reynolds would need in order to expect a positive result on average. I used the following inequality to calculate that:
In this inequality, p is the probability of success, 1 - p is the probability of failure, 0.29 is the value of scoring from 3B, and –1.06 is the value of failing to score from 3B. Solving this inequality for p reveals that Reynolds would need about a 79% probability of success to make going for it worth it. So, did he have at least a 79% chance of scoring?
In the 1987 and 1988 seasons, while Bo Jackson was playing LF with a runner at first and a Double was hit, 12 runners tested Bo’s arm. 2 of them were unsuccessful, implying that Bo cut down about 17% of runners who tested his arm. This also implies that about 83% of runners would be successful in advancing. There is more nuance to it than that, obviously, but it does provide a solid baseline reading for Harold’s success rate. From that alone, it looks like Reynolds should definitely go for it. But, maybe I could dig a little deeper by analyzing the footage.
There is not a continuous shot that shows where Bo fielded and threw the ball with relation to Reynolds’s position on the basepaths, but it would seem the throw isn’t made until around the time Harold rounds third base. From counting frames and converting those into seconds, I estimated that Reynolds was running at around, but likely slightly less than, 30 feet per second. According to the Statcast Sprint Speed Leaderboard, that would be elite sprint speed around the bases.
If it took Reynolds about 3 seconds to travel the 90 feet from third to home, and Bo threw the ball around the time Harold started that run, then that means he only has about 2.5 seconds to get the throw into catcher Bob Boone. This should allow for Boone to correct and make the tag.
Bo fielded the ball fairly close to the left field line, just in front of the warning track. In the Kingdome, it’s 316 feet down the line. MLB warning tracks are about 15 feet wide, so let’s just say Bo Jackson threw the ball approximately 300 feet away from home plate. That would mean the throw has to be on a line at approximately 81.8 mph in order to have any hope of nabbing Harold Reynolds at the plate. Statcast has an Arm Strength Leaderboard that calculates the average velocity of the top 10% of an outfielder’s throws. While 81.8 mph would be pretty much at the bottom of the leaderboard for leftfielders, it’s worth remembering that Bo Jackson didn’t make this throw like he would, say, if he caught the ball on the fly and was trying to nab a runner tagging at third base. He doesn’t have a “head of steam.” He’s not able to step into the throw. He has to launch basically from a standstill.
The throw also has no margin for error in terms of its trajectory. At that distance from home plate, even 1 degree off would be about 5 feet. If Bob Boone fielded that ball 5 feet to either his left or his right, then I don’t think he is able to tag Reynolds in time. It probably comes as no surprise to anyone, but I believe Harold Reynolds made the correct decision in trying to score there. At the very least, he has a better than 79% chance of scoring there. We just happened to see one of the approximately 21% of times that he didn’t. And, honestly, thank goodness that’s the world we’re living in! It’s one of the most spectacular defensive plays in the history of the sport.
As I mentioned earlier, this play is a staple of any Bo Jackson highlight reel—a showcase of his once-in-a-generation talent. But for Harold Reynolds, it’s likely the most memorable moment of his Big League career, dubiously so. In that instant, he had the chance to be the hero, to score the winning run, to ignite the crowd, to write his name into Mariners lore. (Okay, again, maybe a little bit hyperbolic . . . ) Instead, he became the butt of the joke. I don’t blame him for trying.
As I typically do with these projects, I dug a little deeper to see if I could find anything fascinating about the seemingly unmemorable career of Harold Reynolds. What I found was something far more compelling than this one play could ever be–a statistical anomaly that left me giddy with curiosity. Exploring this topic helps reveal so much about what it means to be successful and valuable on the basepaths. To fully explain, we’ll need to rewind two seasons from the time of this infamous moment.
In 1987, Harold Reynolds had one of the strangest baserunning seasons in baseball history. Let’s dive in!
The Good, The Bad, and The Neutral
The career of Harold Reynolds wasn’t all lowlights or unmemorable moments. I mean, most of his career was made up of those moments, but not all of it! Take a look at his 1987 season, for example. I found all American League batters with at least 400 PA that season and plotted their Caught Stealings vs. their Stolen Bases. See Figure 2A below.

Harold Reynolds led the American League in Stolen Bases with 60. Check out Bo Jackson’s total. He’s nowhere near Harold Reynolds! Even Bo Knows that Harold Reynolds has him beat.
I discussed the value of stolen bases in a previous article, but I’d love the opportunity to expand on just how much taking bases contributes to a team’s run scoring potential. For this exercise, I’ll be using the Run Expectancy Matrix again. Let’s start with the steal of second base!

Say Harold Reynolds is at first. No one else is on. There are no outs. Per the Matrix, Reynolds’ Mariners would be expected to score 0.85 runs until the end of that half-inning. Suppose Reynolds breaks for second and is successful in his attempt. Runner at second with no outs would be a RE of 1.11. Using RE24 again, that results in a net of 0.26 expected runs for Seattle.
Suppose instead that there was 1 down. 0.51 runs would be expected to score. Steal second, making it runner at second with 1 down, and that makes it 0.67 runs, a net of 0.16. Make it 2 outs, and the steal of 2B nets 0.10 runs.

However, as I also outlined in a previous article, SB cannot be looked at in isolation. They must be considered in conjunction with the Caught Stealing. If Reynolds is unsuccessful in his steal of second with nobody out, then it’s nobody on with 1 out. Before the caught stealing, one would expect 0.85 runs to be scored. After the out, 0.20 runs. That’s a loss of 0.60 expected runs–about 2.3 times more costly than stealing the base. With 1 out, the CS loses 0.41 runs, about 2.6 times as costly at the stolen base. With 2 out, -0.22 runs, meaning the caught stealing is about 2.2 times worse than the extra base in that scenario.
I really love exploring these scenarios because it emphasizes just how precious your 27 outs are. It also helps us quantify how successful you have to be in a particular scenario to determine if going for the steal is worth it. In these three scenarios, the breakeven success rate is around 69 to 70%, meaning that you need to be successful in about 7 out of 10 steals of 2B in order to not cost your team runs.
While I am sure you all understand the point, I do want to show you one more scenario real quick. Let’s consider the steal of third base! (I absolutely love this one!)
Say it’s runner at 2B, no outs. The steal of 3B would net 0.22 runs. Get caught stealing 3B and you cost the team about 0.86 runs. You would need to be successful in about 80% of your steals of 3B with no outs to make that worth it.
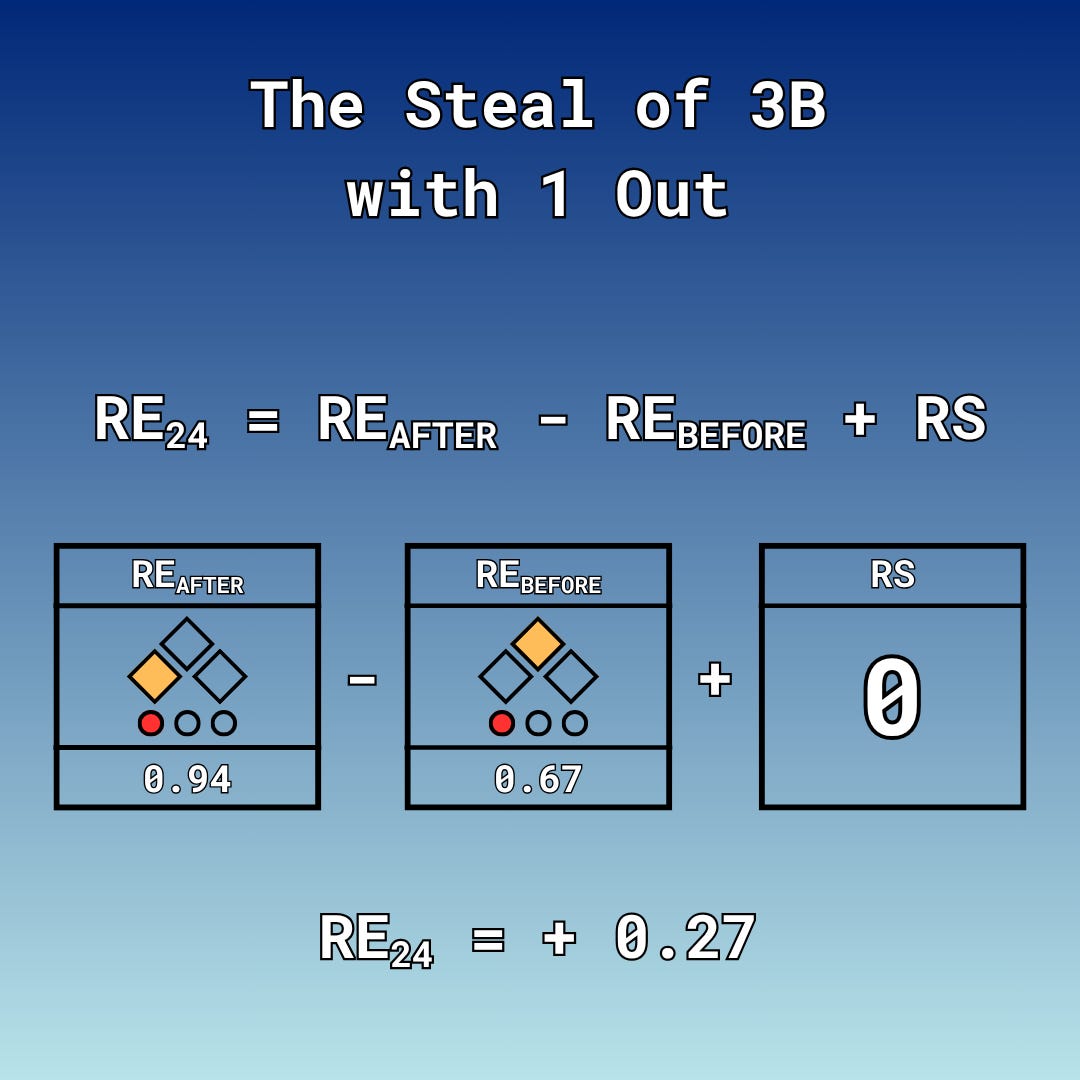
However, this is where it gets really interesting! Say it’s runner at 3B, but this time there is 1 out. Steal 3B and you net 0.27 runs. Get caught and you lose 0.57 runs. You only need to be successful in about 68% of your attempted steals of 3B with 1 out. Just that one out makes the proposition of taking that extra 90 feet so enticing. With no outs, that runner at second is in a great place to score. That extra 90 feet does mean something, but not as much considering you have at least a couple outs to spare in order to get him home.
But, add that extra out, and suddenly that runner at 2B does not have as much potential. The steal of 3B with 1 out means that any ball to the outfield probably scores that runner. Depending on the game state, that extra 90 feet might be the difference between a win and a loss.
Anyway, thank you for indulging me for a moment! Back to Harold Reynolds!
In 1987, Reynolds was only caught 20 times, meaning that he was successful in 75% of his stolen base attempts. This was decently above the American League’s 69% success rate that season. On the surface, it looks like he had a solid, positive impact on the Mariners with his baserunning.
To measure how great of a season he had, I decided to use Baseball Reference’s Baserunning Runs Above Average (Rbaser). Essentially, it’s an estimate of how many runs above or below average a player added with their baserunning. 0 is average. Anything above 0 means that the player contributed that many more runs above average, and anything below 0 means that player cost his team that many runs below average. Reynolds stole with volume and efficiency, so that likely means he contributed a lot of runs above average with his baserunning. Below in Figure 2E we see the same scatterplot as Figure 2A but with color added to represent the player’s Rbaser. Red means runs above average, and blue means runs below average.
And there we see Harold Reynolds is . . .

BLUE?!
Among players in this sample, by Rbaser, Harold Reynolds was tied as the 2nd worst baserunner in the American League that season. Figure 2F below shows the company Reynolds was with.
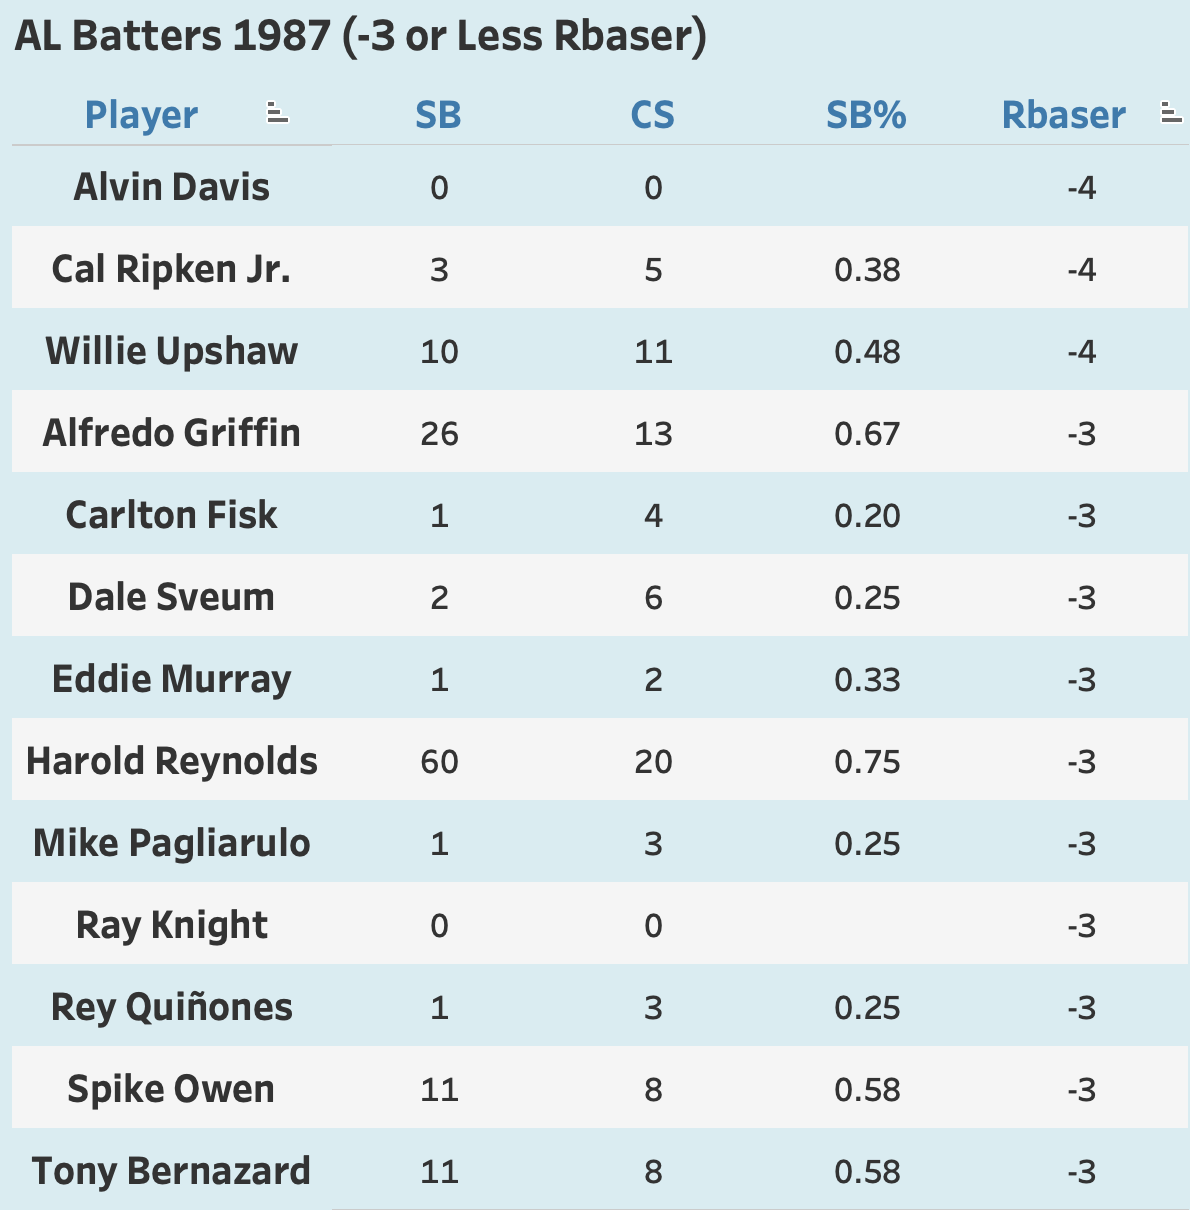
How does this make any sense? None of these other chumps could even reach a 69% Stolen Base success rate. Heck, some of them couldn’t even reach 50%! Harold Reynolds nearly stole more bases than everyone on this list combined.1 80% of Carlton Fisk’s stolen base attempts were outs, yet he and Harold Reynolds both earned -3 Baserunning Runs? Ray Knight didn’t even attempt a stolen base all season, yet he earned -3 too? If anything, shouldn't he be a zero? Bo Jackson went 10 for 14 (71.4%), which is basically League average. It makes sense he’d grade out as a net-neutral baserunner!
To understand why Harold Reynolds was a net-negative baserunner we need to look beyond the Stolen Base, because baserunning encompasses far more than simply swiping bags. We’ll explore this topic by focusing on Harold Reynolds—The Bad—Bo Jackson—The Neutral—and that third player I’ve highlighted—The Good. Studying their behavior on the bases will help illustrate the difference between Good, Bad, and Neutral baserunning.
So, who is that anonymous man? Well, he was actually a teammate of Bo Jackson during his time with the Royals. Unlike Bo, he wasn’t talked about much, largely being forgotten post-playing career. However, just like Bo Jackson, he was one of the most electrifying players of the 1980s.
Enter Willie Wilson.
Free Willie
Willie Wilson was the primary left/center fielder for the Kansas City Royals throughout the entirety of the 1980s. His offensive profile as a batter? Free swinger! From 1980 to 1989, his 4.7% walk rate was 44% worse than the League average. However, his .289 AVG was 10% better than the League average. Willie wanted to swing the bat!
When Willie was on the base paths, however, is where he really shined. In 1979, he led the American League in Stolen Bases with 83. Willie was also only caught 12 times, good enough for an 87.4% success rate. Baseball Reference awarded his 1979 season 18 Baserunning Runs above average, the second most for any season since Integration. Number one is 19, coming in Maury Wills’ legendary 104 SB/88.9% success rate season in 1962, which I’ve documented in a previous article.
By 1987, Willie was slowing down in terms of his Stolen Base totals, but he was still incredibly efficient. He swiped 59 bags while only getting caught 11 times. That’s an 84.3% success rate–well above the AL’s success rate. Compare that to Harold Reynolds. He stole 1 more bag than Wilson, but was caught 9 more times. That’s a 10% success rate just on the excess. Not good!
I think it’s clear that Willie Wilson actually had the better base stealing season over Harold Reynolds, but how does all of that add up to a 14-run margin in their Baserunning Runs? As I mentioned earlier, baserunning is more than SB and CS. Unbeknownst to some, Baseball Reference actually tracks a wide range of baserunning statistics in a separate tab on player and season pages entitled Baserunning/Misc. I’ll be using that tab from the 1987 American League season to explore a wide range of different baserunning outcomes and how they impact run scoring potential. Rather than simply telling you how Rbaser is calculated, I attempted to craft my own version of Baserunning Runs that I’ll call Error Baserunning Runs (Ebaser) in hopes that the process will make the evaluation of baserunning intuitive. Let’s start with those Stolen Bases and Caught Stealings!
We could simply calculate the exact RE24 for every single steal and caught stealing. This number would be very precise in terms of what that player contributed with their base stealing. We could then compare each player’s number to the average. If their contributions are higher than average, then they contributed positively to their team. If their contributions were below the League average, then they are actually costing their team baserunning value relative to the average. Those players would be debited as such.
This method does have flaws, however.
When batters step to the plate, they all have equal opportunities to make contributions. However, as soon as they reach base, their opportunities to make contributions shift, becoming more dependent on external factors such as lineup construction and game situation. This means simply using the raw, bulk totals of SB and CS could be misleading.

In Figure 3A above, we see the distribution of Stolen Base Opportunities (SBO), defined as the number of times a player is on first or second with the next base open. Royals CI Kevin Seitzer had the most opportunities (353) and White Sox CF Ken Williams saw the fewest chances (124). That’s a range of 229 chances, indicating a lot of variability. For additional reference, the median number of chances in this sample is 203, while the mean is 212. The opportunities to steal bases is skewed. Why does this matter?
Consider Rangers CF Oddibe McDowell. He had only 153 SBO–bottom 10 in this sample. However, he made the most of his few opportunities. In the sample, the average attempt rate was about 8.4%. Oddibe attempted a steal in about 17% of his total chances. He went 24 for 26 on steals, representing a hyper-efficient 92.3% success rate. If he could maintain that level of efficiency in Seitzer’s chances, then he could have gone roughly 55 for 60. Our evaluation of baserunning should credit efficiency and debit inefficiency, but it should also properly weight how often that player attempted a steal relative to their chances. A player with an 80% success rate is positively impacting their team, and should be credited as such. However, if they only attempted in about 5% of their chances, then they are likely leaving value on the table. If we just considered the raw SB totals, Oddibe would be discredited for his volume simply because he had fewer chances, not because he wasn’t a good base stealer.
The final consideration is whether this number should really be context-dependent. I postulated earlier that we calculate the RE24 for every single base-out state that a player either steals or gets caught stealing, but that’s falling into the same trap as above. Context is unevenly distributed. As detailed earlier, the most lucrative steal of third base is with one out. If all 6 of Harold Reynolds’ steals of third came in that exact scenario, then he’d be maximizing his contributions. However, this wouldn’t mean that Reynolds is more skilled. It would just mean he’s more fortunate. No player can control when they have such chances.
That’s why our calculation of baserunning runs should be context-neutral. Instead of focusing on specific game states, we should assign a league-average run value to successful steals and caught stealings. This strips away the noise of circumstance and lets us evaluate a runner’s true impact—not the luck of when they happened to run.
Based on the scenarios outlined earlier, I figured a successful steal is worth about +0.2 runs, and getting caught stealing is roughly 2.3 times as costly, for a value of -0.46 runs. These represent the run value of each event.
I multiplied each player’s SB and CS by these run values and added them together. This gives the net run value of a player’s steal attempts—a number that inherently rewards efficiency.
Next, I calculated the league average run value per stolen base opportunity. I multiplied that average by each player’s total SBO to find out what an average runner would have contributed given the same number of chances.
Finally, I subtracted that expected value from the player's actual run value. The result is my version of weighted stolen bases—a stat that accounts for both efficiency and opportunity.

By this particular metric, Willie Wilson was the best base stealer, netting +6.8 runs above the average base stealer. He was so efficient, he really should have made more attempts. Harold Reynolds was very aggressive in stolen base chances–42.3% of the time he attempted a steal. To his credit, he was efficient, though not dramatically so, netting +2.8 runs. If he had picked his spots more carefully, he could have been a lot better. Bo Jackson was slightly better than the League average efficiency and attempt rate. He made marginal gains compared to the League average, as his +0.2 runs from weighted steals indicates.
But, still, note how Harold Reynolds is a positive base stealer. Yet, he graded out as a net-negative base runner. What are we missing?
To understand the concepts I am going to explain, let’s set some expectations. Like I outlined at the beginning of the article, when a player is on the bases when a certain hit is made, the expectation is that a player should advance, at the very least, the same number of bases as the batter. So, with a runner on first with one out, if the batter at the plate hits a Single, then we would expect, at a bare minimum, for that runner to advance one base and end up at second. Such play is known as going “station-to-station.” It represents the basic expectation–a conservative, neutral way of running the bases. However, taking the extra base would be if that same runner dug for third base and made it safely. They took an extra base beyond what is expected of them.
To illustrate this, let’s say Harold Reynolds is at first base with one out. The batter at the plate hits a Single. At a bare minimum, Harold Reynolds would end up at second base, making it first and second with one out. By the RE Matrix, that would offer a run expectancy of 0.90. Because this represents the bare minimum expectation–Harold Reynolds ending up at 2B–I’ll use that base-out state as the initial snapshot (RE Before). This will help communicate how much taking an extra base really adds.
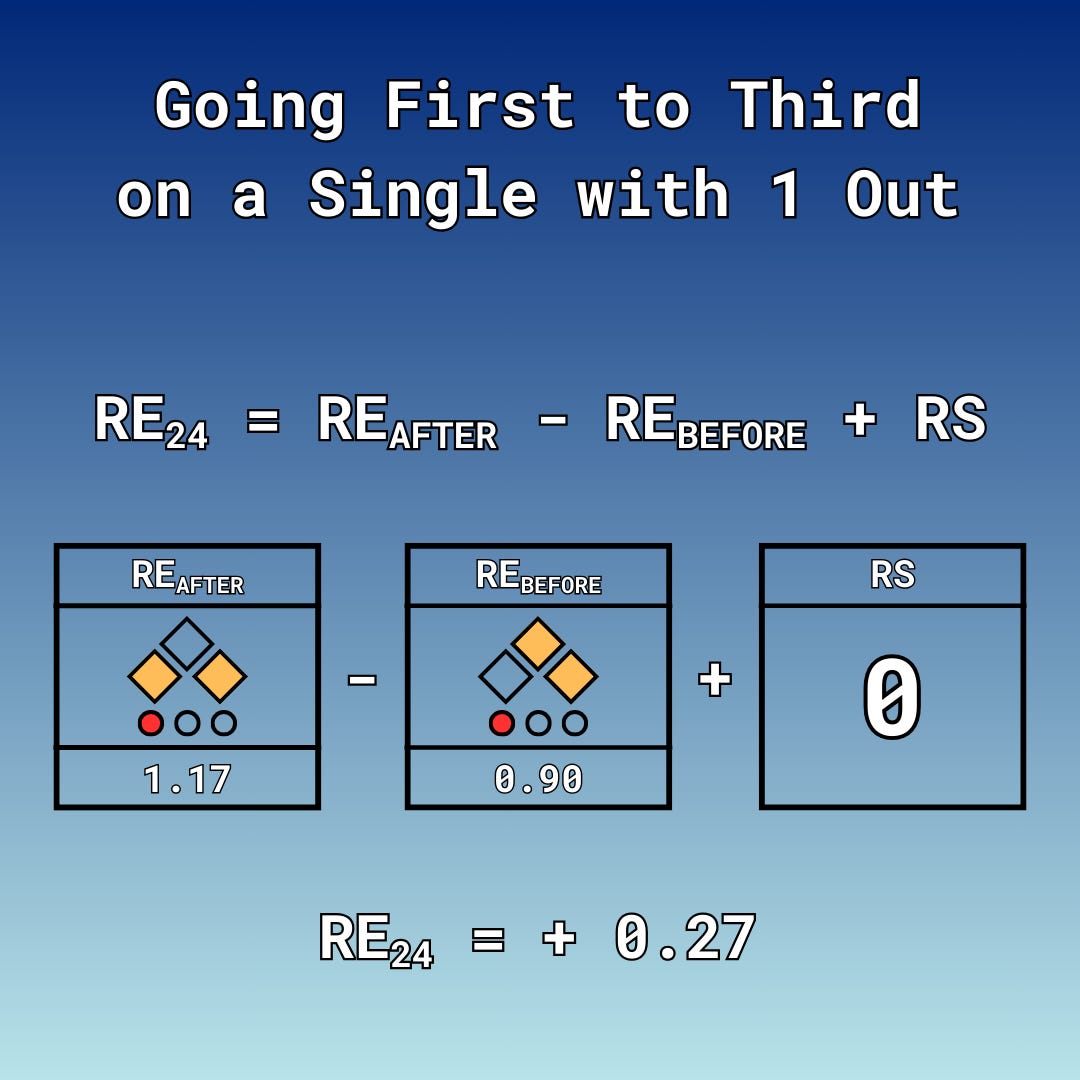
Harold Reynolds decides to dig for third base. The outfielder knows he’ll never get him, so the throw goes into second, keeping the batter-runner at first. That makes it runners at the corners with one down, a run expectancy of 1.17. Using the bare minimum of being at second base as the starting point for the RE24 calculation, taking third in this scenario adds 0.27 runs. If there were no outs, then taking third adds a quarter of a run–similar, but less than with 1 out. 2 outs? That’s a measly 0.06 runs.
If we wanted to determine how many runs a player added or subtracted by taking the extra base or not taking the extra base, then we could simply calculate how many extra bases a player added, compare that counting number to the League average, and adjust from there. However, just like the last exercise, this approach fails to account for the variability in baserunning opportunities.

Figure 3D displays the distribution of frequencies a runner was on second base when a Single was hit during the 1987 season. The median number of such chances was 17. Players on the low end had as few as 3 opportunities, indicating a 14-chance range in the lower 50% of the distribution. At the high end, players had up to 40 chances—a 23-chance range in the upper half. The disparity is clear: some players simply have far more opportunities to add value through baserunning than others.

Figure 3E illustrates why it's crucial to consider baserunning rates rather than raw totals. The table shows the top 10 players in the rate of going from second to home on Singles during the 1987 season. At 6th on the list, we find Brewers DH Paul Molitor. He led the AL in total opportunities to be on second base when a Single was hit. Great job, Molly!
However, that’s largely a credit to his bat. He led the AL with 41 Doubles, so he was standing at second base quite frequently. While there could be situations where Molly added some of those Doubles through excellent baserunning–the patented Hustle Double™–for the most part we account for Doubles in hitting statistics. Without more enhanced data, like the data offered by Statcast, we should just assume that a Double was earned with the player’s bat, not their legs.
His chances are also a credit to the players hitting behind him in the lineup. Brewers CF Robin Yount, who consistently batted after Molitor that season, hit .315, well above the AL average of .265. Yount’s hitting would help Paul Molitor get all of those chances. To Molitor's credit, he capitalized on those opportunities, scoring from second 90% of the time.
Now compare this to Twins SS Greg Gagne. (Yes, it’s GAG-KNEE!) He scored from second far less often than Molitor, but he actually did so at a higher rate. Gagne's lower total is not due to his performance as a baserunner but rather external factors—his own bat not being as productive–which isn’t what Baserunning Runs attempts to measure–and the hitters at the bottom of the Twins lineup being less productive than the hitters at the top of the Brewers order. The latter factor is most certainly not within Gagne’s control. Gagne’s lower total isn’t a reflection of his baserunning ability but rather the opportunities he had, which were shaped by his teammates and the context of his position in the lineup.
We can estimate how many runs a player added through extra bases by comparing their extra base rate to the League average. In 1987, American League runners took the extra base 46% of the time—suggesting the American League went mostly station-to-station, but not dramatically so.
To calculate value, I first found the difference between a player’s rate and the League rate. Then, I multiplied that difference by the number of opportunities the player had to take an extra base. This gives an estimate of how many extra bases the player added above the average. This approach helps balance out players like Tigers SS Alan Trammell, who led the AL in many baserunning counting stats simply because he had so many opportunities. While he accumulated a lot of extra bases, his actual rate of taking them (51%) was only slightly above average.
Finally, I converted those added bases into runs using the same run value I applied to stolen bases, 0.2 runs per base. The result is the player's weighted Extra Bases (wXB)—a stat that captures value added through aggressive, efficient baserunning outside of stolen base attempts.
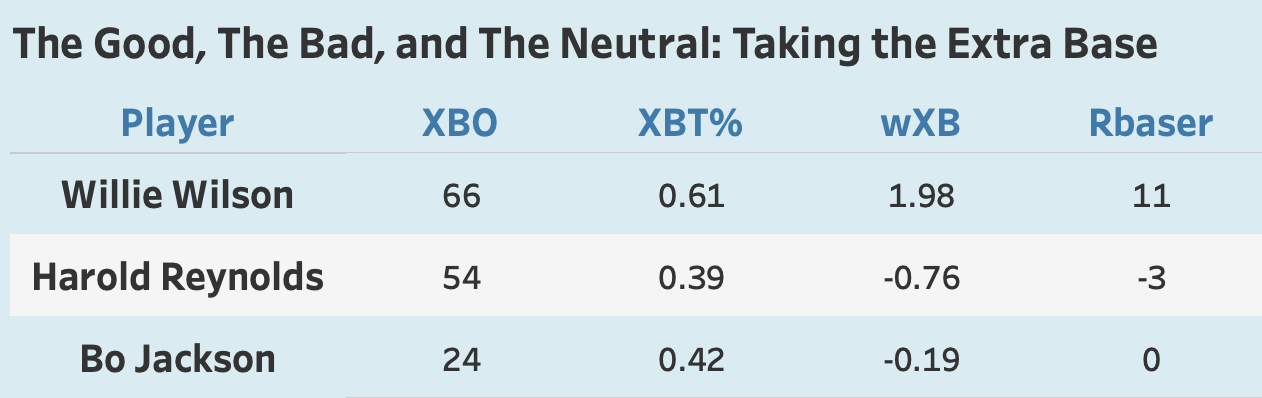
Willie Wilson stands out. He was a real menace on the basepaths—advancing the extra base an impressive 61% of the time. While each extra base may only be an incremental advantage, do it consistently, and those runs will start to add up. By my calculation of Weighted Extra Bases, Willie Wilson added about 2 runs above the average player.
Bo Jackson was below but still close to the League average. His contribution was modest and only slightly detrimental when compared to the average. His conservative approach to running the bases was basically in line with what you’d expect. Already, he’s pretty much negated his positive stolen base contributions by not taking the extra base as consistently as the rest of the American League.
And then there’s our buddy Harold Reynolds. Only 39% of the time did he successfully take the extra base, well below the League average. Compared to his peers, Reynolds left a lot of bases—and, by extension, runs—on the table. It's especially puzzling given how aggressive he was as a base stealer. One might expect that same mentality to translate to taking extra bases.
Or, maybe, he was aggressive . . . it just didn’t pay off . . .
Oh no.
Just like with the Stolen Base, there is a negative side to taking the extra base. We must consider Outs on the Bases (OOB), or sometimes lovingly referred to as the TOOTBLAN (Thrown Out on the Bases Like a Nincompoop). Baseball Reference accounts for these outs on the bases in multiple ways. Let’s start with Pickoffs!
The distinction between a Pickoff and a Caught Stealing lies in the runner's intent and movement. If the pitcher steps off and throws over to nab a runner who isn’t attempting to advance to the next base, it’s a Pickoff. However, if the runner commits to advancing to the next base—even after the pickoff move—it’s scored as a Caught Stealing. Regardless of how it’s scored, the outcome is the same as the Caught Stealing.

Harold Reynolds led the American League with 10 Pickoffs in 1987. To help put that into perspective, the Seattle Mariners as a team led the American League in times getting picked off with 20. 50% of those pickoffs are accounted for by Harold Reynolds. His 10 pickoffs amounted to 6.3% of the entire American League total. 5.3% of his opportunities to steal bases he was picked off. Among batters in the sample, the median was 0.4%. That’s not aggression. That’s recklessness.
In terms of other outs on the bases we can track, we’ll return to our example where Reynolds was at first base with one out and the batter singled. The expectation is that Reynolds should end up at second, which is a RE of 0.90. But, Reynolds decides to push the envelope.
He’s digging for third!
Here comes the throw . . . the tag . . .
He’s out!

Now instead of runners on first and second with one out, we’ve got a runner on first with two outs. The new RE? 0.22. That failed advancement just cost the team 0.68 runs—nearly two-thirds of a run. Trying for that extra base better be worth it, because the cost of a TOOTBLAN in this situation is more than 2.5 times as detrimental as the extra base.
I think you know where this is going . . .

Harold. Buddy. What are you doing?! 14 TOOTBLANs?! That’s the most in the American League! No wonder your Baserunning Runs were so low! You got thrown out on the bases like a nincompoop!
If we consider these 14 outs on the bases to his entire chances, that’s 26% of the time that he made an out. The median of the sample was 11%. Willie Wilson’s 6 outs represented 9% of his chances. Bo Jackson’s 5 represented 21% of his.
In much the same way as I calculated weighted extra bases, we can estimate the number of runs a player cost their team with outs on the bases, or added by avoiding outs. First, I found the percentage of these types of outs made–pickoffs and TOOTBLANs–per stolen base opportunity, being on first base when a Single is hit, being on first when a Double is hit, and being on second when a Single is hit. Then, I subtracted the League average rate (2.7%) from the player’s rate. This represented how much more or less frequently the player made outs on the bases on a rate basis. I multiplied that difference by their total chances, representing the number of outs above or below the League average. Finally, I multiplied that number by -0.46, the constant I chose to represent the run value of an out.
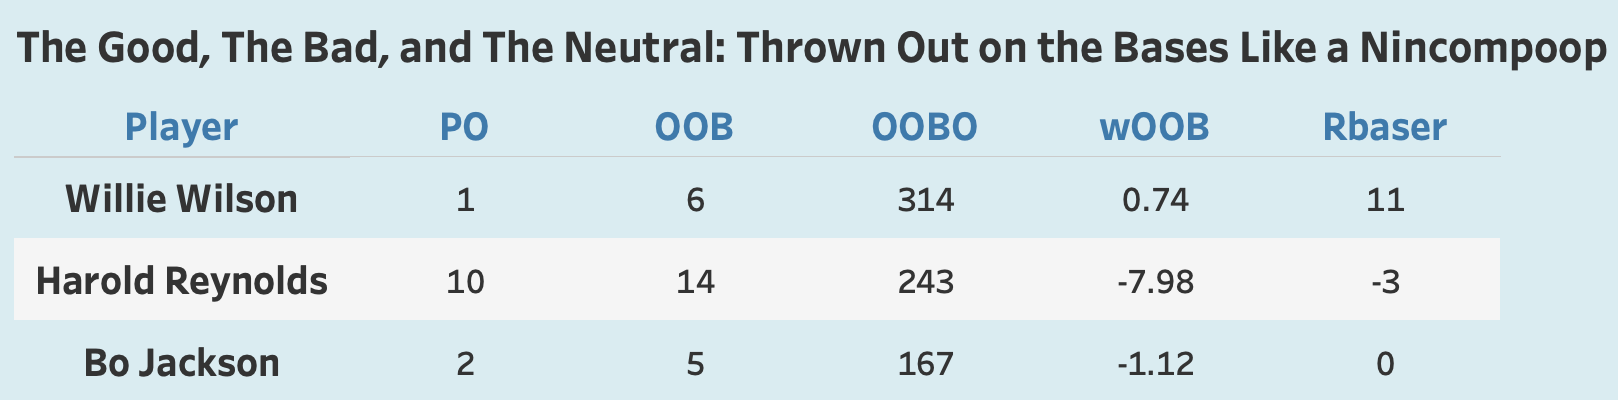
Willie Wilson avoided outs on the bases like the plague, saving the Royals offense about three-quarters of a run when compared to the average player. Bo Jackson really solidifies why accounting for the rates of these statistics is so important. He made the same number of outs on the bases as Willie, but he collected those outs in fewer chances to do so. My calculation rightfully debits Bo. If given more opportunities, he’d likely produce more outs.
And then there’s our friend Harold Reynolds . . .
Harold Reynolds made 24 total outs on the bases, which on its own is quite remarkable. It probably helps explain why his rate of taking the extra base was so low. He took risks that didn’t pay off.
By my estimation, he cost the Mariners about 8 runs due to his reckless abandon on the basepaths. His -7.98 weighted outs on the bases came in 105th among players in the sample. As a reminder, there are 105 batters in this sample!
The gap between Harold and the next worst, A’s SS Alfredo Griffin with -3.2 weighted outs, is the same as the gap between Alfredo Griffin and Rangers LF Pete Incaviglia, who was 17th best among players in the sample with +1.5 weighted outs.
With these weighted metrics for stolen bases, extra bases, and outs on the bases, I summed them to create Error Baserunning Runs Above Average (Ebaser). Below in Figure 3K, you’ll find a scatterplot showing how my estimation of baserunning stacks up with Baseball Reference’s.
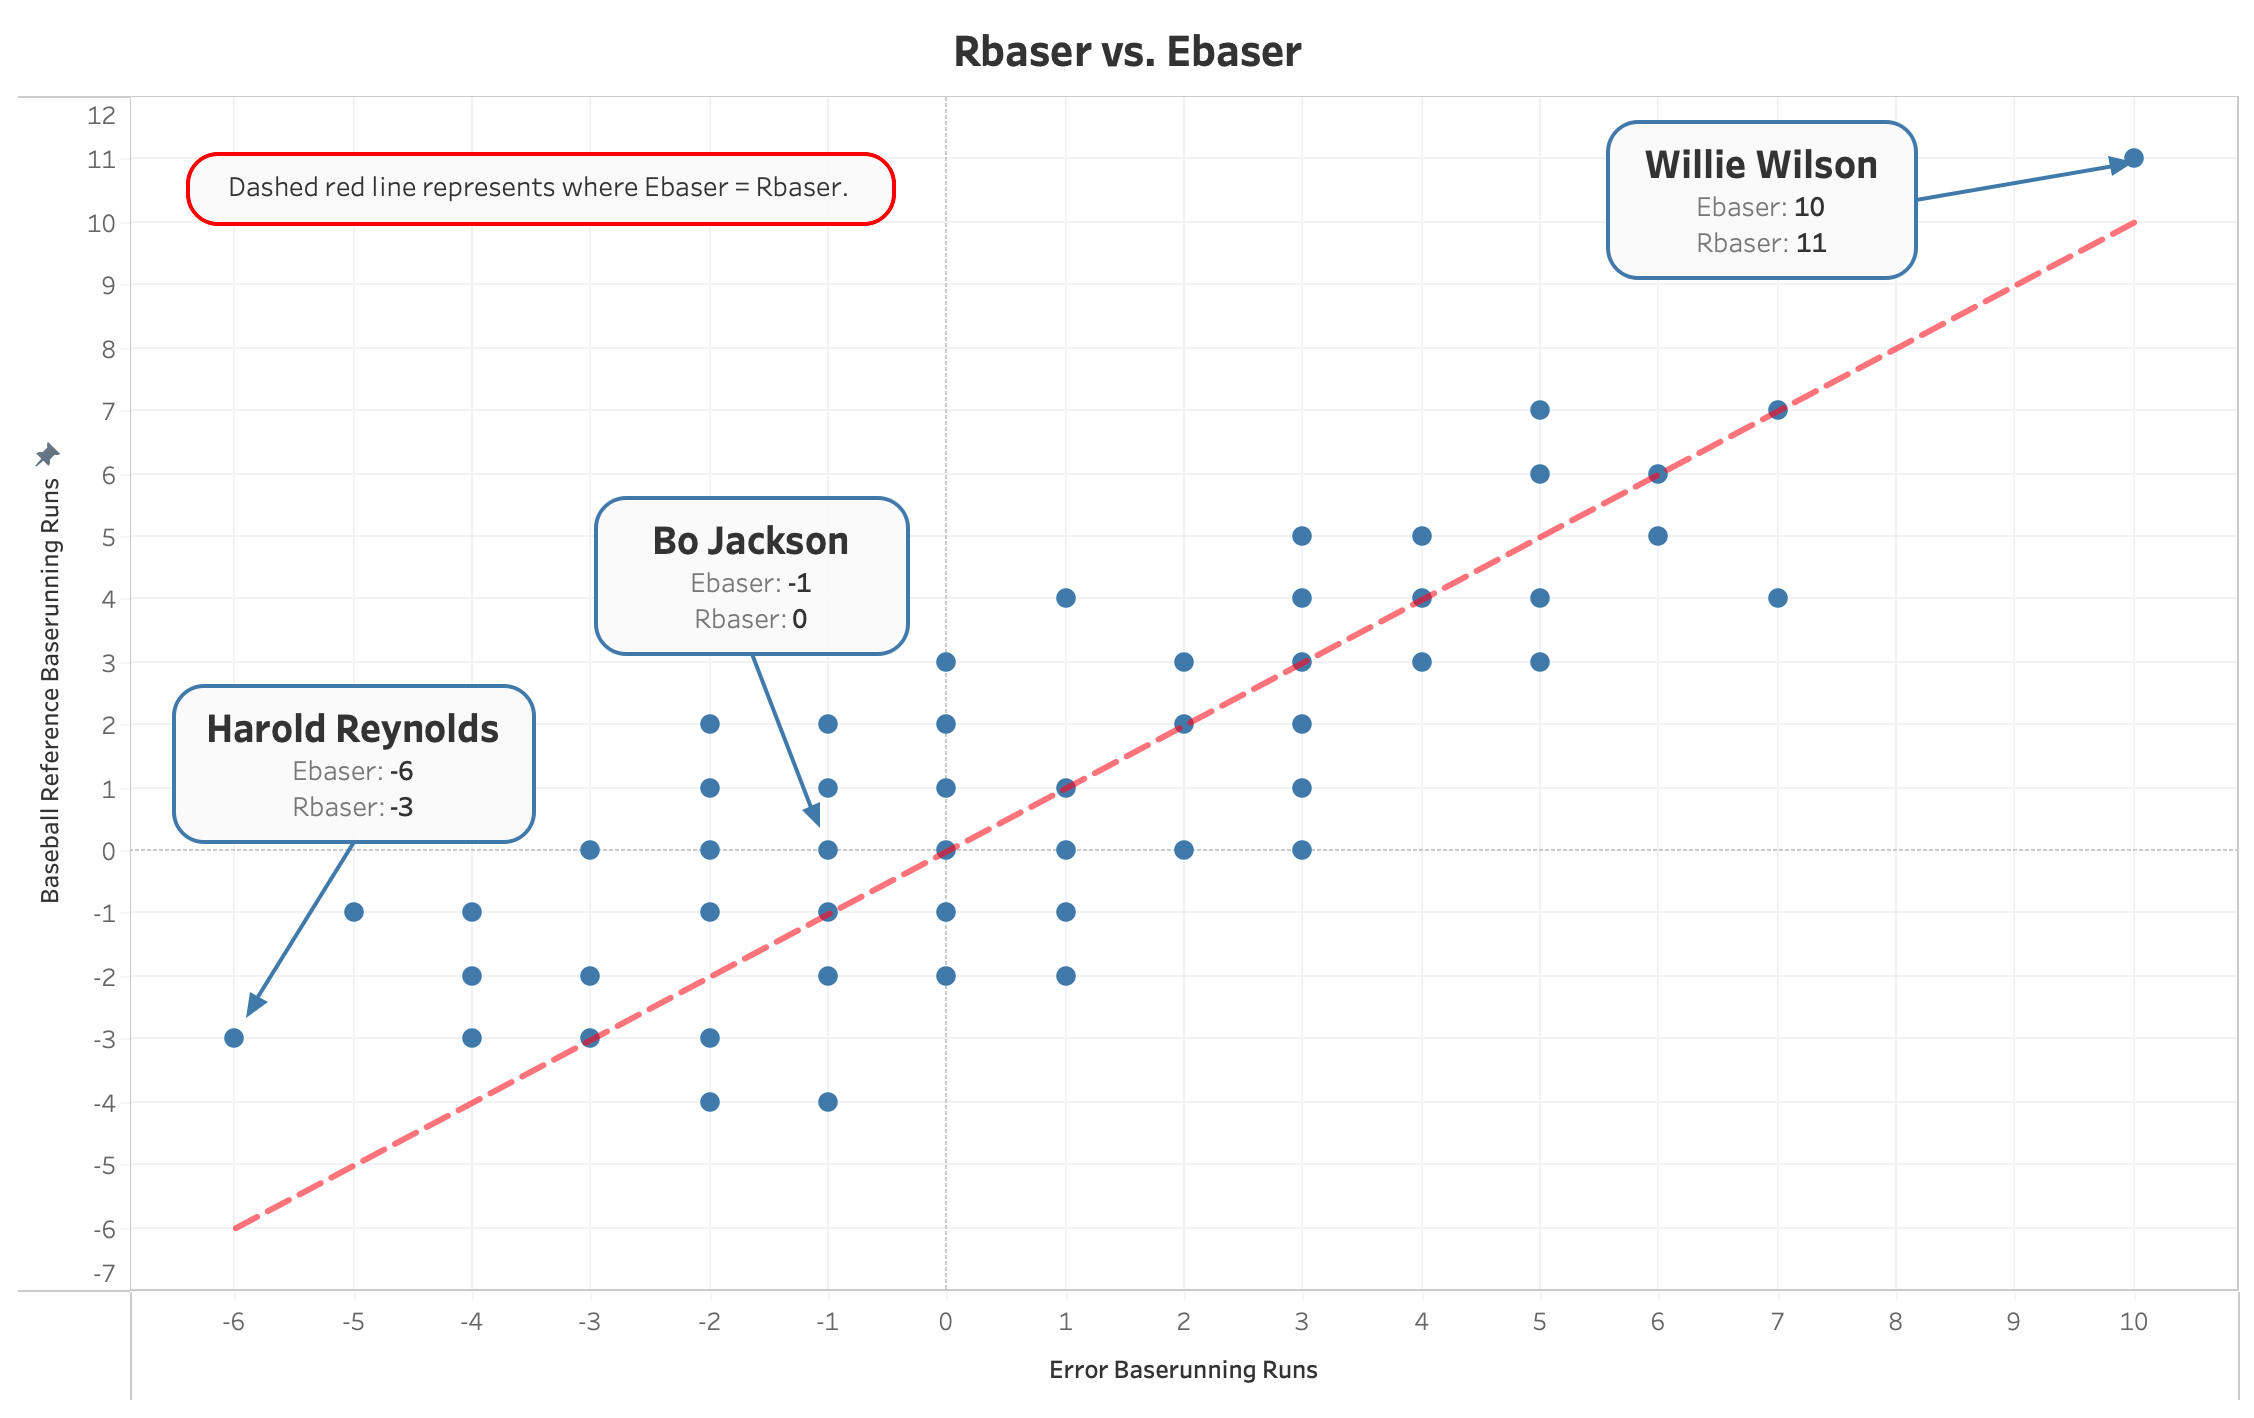
By my evaluation, Willie Wilson and Bo Jackson were pretty much in line with what Baseball Reference estimated. I had Willie at +10 baserunning runs and Bo Jackson at -1. However, my metric ended up debiting Harold Reynolds a lot more than Baseball Reference. He graded out at a -6 by Ebaser.
The reason for this exercise was to hopefully build your intuition for how and why we might calculate these run values the way we do. It also shows that there are many ways to skin the proverbial cat when it comes to valuing a player’s contributions on the bases. My methodology was pretty simple, and lacked some of the additional nuance that might go into similar metrics, like Rbaser on Baseball Reference or Ultimate Base Running (UBR) on Fangraphs. However, directionally speaking, I was not too far off from Baseball Reference’s estimation. I took the absolute value of all of my misses and averaged them out. Ebaser only tended to differ from Rbaser by about 1.2 runs. About 26% of the sample I nailed. About 68% of the sample I missed by at most one.2 Regardless, it all starts to come together to paint the picture of aggression versus conservatism.
Be aggressive, and do so successfully? That means you're adding more than you’re subtracting. That’s Willie Wilson!
Be aggressive, but get thrown out a lot? You’re negating all of your positive impact. That’s Harold Reynolds!
Don’t take risks and just do the bare minimum? You’re adding and subtracting negligible amounts of runs. That’s Bo Jackson!
Do whatever this is . . .
Yeah . . . Don’t be Rubén Rivera.
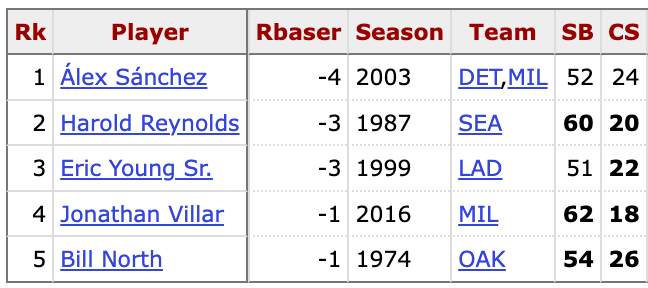
By the traditional statistics like SB and CS, Harold Reynolds seemed to have a great baserunning season. Dig a little deeper and you find that his aggression was actually a detriment both to the Mariners and his own statistics. Harold Reynolds’ 1987 season is one of only 5 seasons across the entire history of the National and American Leagues where a player stole 50 or more bases and graded out as a negative baserunner by Baseball Reference’s Baserunning Runs.
It’s the type of behavior on the bases that is maddening to fans, but absolutely delightful for the neutral observer. It represents a sort of brazen confidence. It’s as if Harold Reynolds believed his speed could bend reality to his will.
I wouldn’t blame him for thinking that, though. The 1987 Seattle Mariners were a pretty mediocre offensive team. Reynolds, and maybe the entire coaching staff, likely felt that the only way they could even hope to score runs was to force the issue on the bases. Unfortunately for the M’s and Harold Reynolds, that risk didn’t have much in the way of reward. What could have been a famous baserunning season was ultimately below average.
But, here’s the thing. I’ve actually been lying to you this whole time!
Harold Reynolds, in 1987, was actually a net-positive baserunner!
Well, maybe . . . kinda . . . it depends on your perspective.
Let me explain!
Double Play Indemnity
Let’s consider another common game state. Runner at first base, nobody out. By the Run Expectancy Matrix, that’s a RE of 0.85. Batter grounds the ball to short. 6-4-3, routine Double Play. Nobody on with 2 outs. 0.10. That’s a loss of 0.75 runs. However, let’s say the batter is a real burner.
6 to 4 . . . Out there!
Second baseman on the pivot to first base . . .
SAFE!
Runner beats it out!
That would make it runner at first with 1 out, a RE of 0.51. Grounding into that Fielder’s Choice is a net-negative, but when compared to the worst case scenario it actually reduces the impact. Beating out the throw to first base saves about 0.41 runs.
If we consider a player’s opportunities to ground into a Double Play–meaning, runner at first or runners at first and second with less than 2 outs and batter hits a grounder that produces at least one out–then we can compare that player’s rate of grounding into Double Plays and estimate how many runs they saved or cost their team on such events. That’s what Baseball Reference’s version of Grounded into Double Play Runs (Rdp) estimates.
Now, the reason I introduced this section the way that I did is because there is some debate as to whether avoiding Double Plays is a baserunning skill or a batting skill. If we were considering all times a batter came to the plate in Double Play situations, then I could see the argument either way. A player could be slow as molasses but either strikeout, walk, or hit the ball out of the infield. That would be Double Play avoidance via the bat, which is not what we’re measuring here. When a player hits a grounder into a Double Play situation, but avoids being put out on the backend, then that’s because of their baserunning, for the most part at least. That is what Rdp is measuring.
In 1987, Harold Reynolds was the most valuable player in terms of avoiding the backend of the Double Play. Baseball Reference estimates he saved Seattle 4 runs more than the average player. Way to go, Harold!
Unlike Baseball Reference, sites like Fangraphs don't strip out double plays from its baserunning metrics. Avoiding the backend of a Double Play is an example of good baserunning, so lumping DP avoidance with the other aspects of baserunning is something I agree with.
Still, I respect Baseball Reference’s approach, since it separates different baserunning skills and gives fans more tools to evaluate players. When we add Harold Reynolds’ Rdp to his Rbaser–as I think we should–he actually comes out ahead. Harold Reynolds netted one run above the average player in 1987 via his baserunning. He wasn’t the best, but he was a solid baserunner who ultimately had a positive impact on his ball club—albeit a small one. And think of how much better his season would have been had he better assessed his own limitations on the basepaths.
Bo Jackson still came out slightly ahead of Reynolds (2 Rbaser + Rdp). But, Willie Wilson easily came out on top again. He added an estimated 13 runs over the average player, just through his baserunning.3 Both Harold Reynolds and Willie Wilson were switch hitters, who batted from the left side against righties in 69.2 and 72.6% of their plate appearances that season. That matters because speedy lefties have a slightly shorter path to first base. (Again, baseball is a game of incremental advantage.) Having roughly 2 feet less ground to cover can be the difference between being out and safe in bang-bang plays. Bo Jackson was always righty, so it’s pretty impressive that he was able to avoid the backend of Double Plays as well as he did.
In terms of rating these players as baserunners “The Good, The Bad, and The Neutral” isn’t accurate. Instead, how about “The Good, the Better, and the Best”?

In terms of who was likely the more valuable player among the three, you have to consider the whole player. That is what WAR attempts to estimate through considering baserunning, batting, fielding, and the position you occupy on the diamond. And WAR uses Rbaser and Rdp in its estimate of value.4
In terms of their bats, Bo Jackson was the best hitter of the three in 1987, but none of them were particularly great with the bat that year. Bo’s 94 OPS+ meant that, by OPS, he was 6% worse than the average batter that season. Wilson and Reynolds were basically tied, rocking 83 and 81 OPS+’s respectively.
In terms of fielding, other than his legendary arm, Bo Jackson wasn’t really all that good with the glove. He made plenty of web gem plays, but that doesn’t always equate to great defense. Willie Wilson’s speed made him a solid defender in the corner outfield, but being a solid fielding corner outfielder isn’t as valuable as good up-the-middle defensive play. Harold Reynolds, on the other hand, was a really good glove at second base–a premium defensive position, harder to fill than the corner outfield spots of Willie and Bo.
While on the subject of defensive position, you also expect more offense from less defensively intense positions like corner outfield. When accounting for that, Harold Reynolds’ meek offensive production is a little more excusable.5 Wilson and Jackson’s below average offense at the corners is less so.
Harold Reynolds' career wasn’t flashy like Bo Jackson’s. Ironically, his most famous highlight is actually a lowlight—getting thrown out at home by Bo himself. He was nowhere near as good of a baserunner as Willie Wilson. He was nowhere near as famous as Bo Jackson. Yet when you factor in every aspect of the game, it was Harold Reynolds who, according to Baseball Reference’s WAR (bWAR), had the last laugh in 1987.

Harold Reynolds’ 2.2 bWAR essentially means that he contributed about 2 more wins with his play over that of a replacement-level, Triple-A caliber player. We’ll explore more on what that means in a future article, but it helps put Reynolds’ as a player into better perspective. Yes, his bat didn’t really produce much in terms of runs, but his glove and fielding at a premium position saved runs from scoring. His baserunning, while ultimately positive, was negligible.
His career wasn’t memorable. I find him pretty annoying to middle-of-the-road as a broadcaster and a talking head. However, no one can doubt that Harold Reynolds was a solid ballplayer over the course of his Big League career. If only he could clean up his baserunning, then he’d grade out a lot better. Maybe he learned his lesson in 1988?
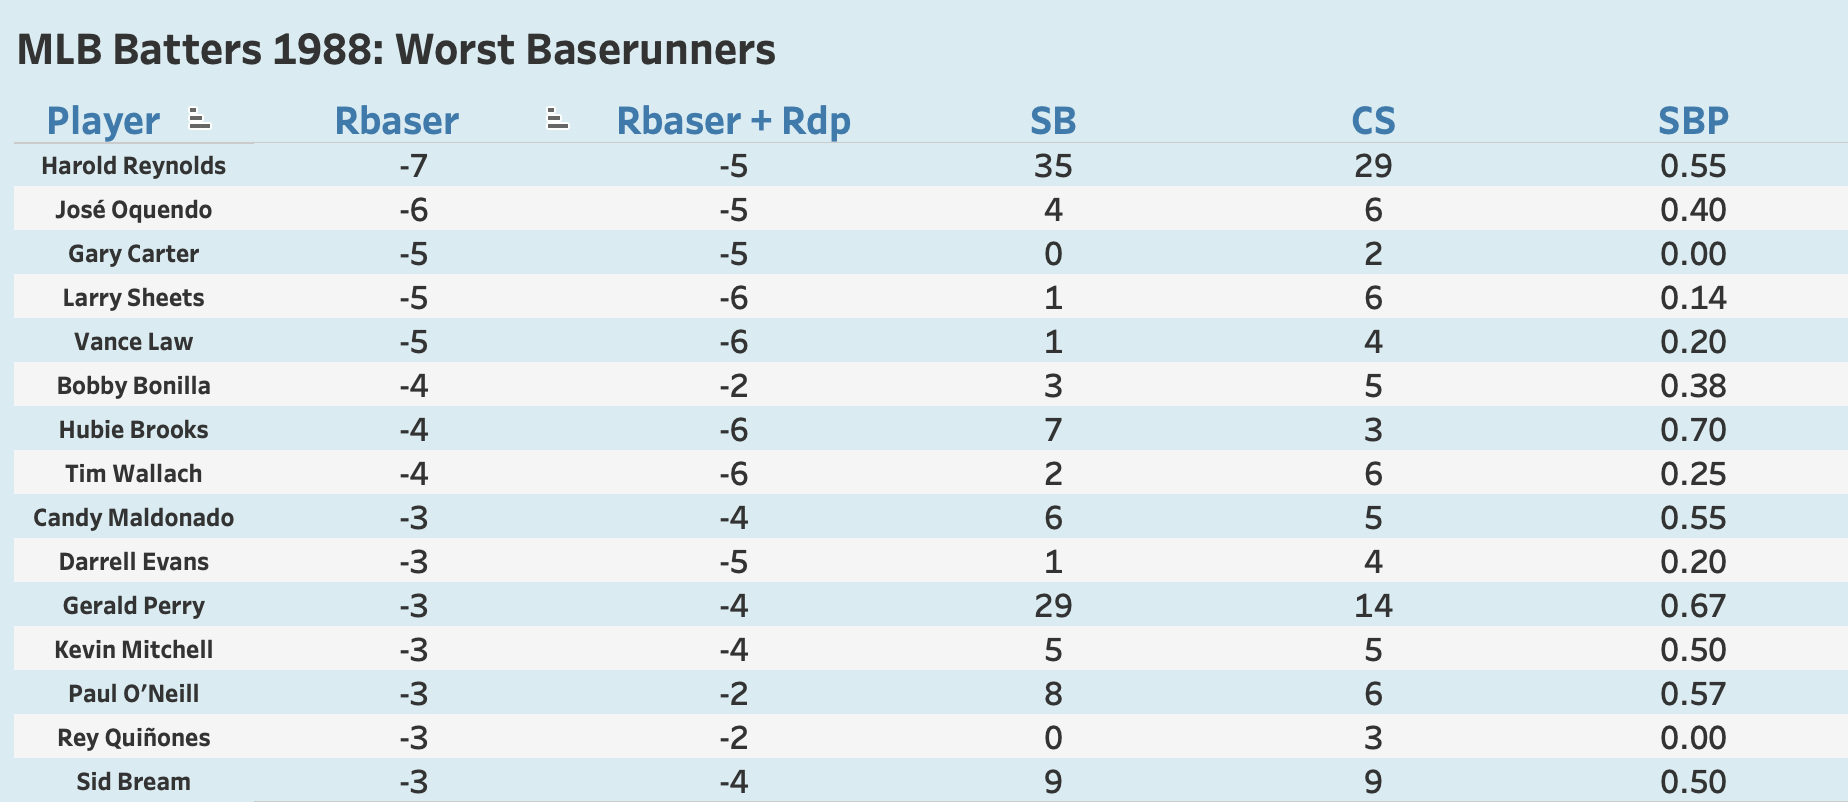
Or . . . maybe not.
Thanks!
Thanks for taking the long trot.
Special Thanks go to Greg Stoll and his Run Expectancy calculator that helped me craft the Run Expectancy Matrix I used a lot this article.
Special Thanks go to Baseball Reference, their Stathead product, and Fangraphs for making baseball data accessible to us all.
Special Thanks to MLB for making the radio calls of these famous plays available via YouTube. I love Jon Miller’s call on Rubén Rivera’s “worst baserunning in the history of the game.”
Special Thanks to Ennio Morricone for his incredible score for The Good, The Bad, and The Ugly.
Special Thanks go to Bo Jackson for his highlight-filled career, and Willie Wilson for his consistent speed and efficiency on the basepaths.
And of course, Special Thanks go to Harold Reynolds whose reckless, aggressive baserunning serves as a reminder that, in the game of baseball, speed kills. What a fun career!
I have made a dashboard so you can explore the data I used for this article yourself. Check it out using the button below!
I have a chat for subscribers to interact with my work and the community I am trying to build. Feel free to drop a line!

See ya next time!
In the audio version of the article, I say that Harold Reynolds stole more bases than the rest combined, when I should have said that he nearly stole more bases than the rest combined.
To be clear, that 13 is Rbaser (11) plus Rdp (2).
Specifically, Baseball Reference’s version of WAR (bWAR). Other versions of WAR, like Fangraphs’ fWAR, us their own versions of baserunning runs.
Among qualified, primary 2B in 1987, only 5 out of the 14 batters rocked an OPS+ of 100 or better. This really shows that the position didn’t really feature particularly good hitters.


